From manual reports to an automated dashboard
Voedselbank Utrecht
- Customer case
- Data Analytics
- Dashboarding



Voedselbank Utrecht aims to provide families and individuals living in poverty with healthy and varied food packages. Data insights are essential for this mission: how many people are being helped, where the greatest needs lie, and how demand evolves over time.
Until recently, these insights were fragmented and dependent on manual Excel processes. This cost valuable time, limited reliability, and made it difficult to accurately measure impact. To solve this, Voedselbank Utrecht sought a scalable and future-proof solution. Through the Datahub, we took on this challenge by providing pro bono data expertise.

Approach
The collaboration started with a briefing to define the main objectives, functions, and KPIs. This clarified which questions the dashboard should answer and which insights would truly make a difference. This phase is crucial to ensure the dashboard delivers relevant answers, as we also explain on our dashboarding page.
We then designed a mock-up that allows for automation, scalability, and growth. Based on that, we built a dashboard that systematically unlocks and visualises Voedselbank Utrecht’s data. Through close collaboration and iterative optimisation, we created a solution tailored to their specific information needs and strategic ambitions.
Upon completion, our Data Analyst explained all functionalities in detail, enabling the organisation to start using the dashboard independently right away.
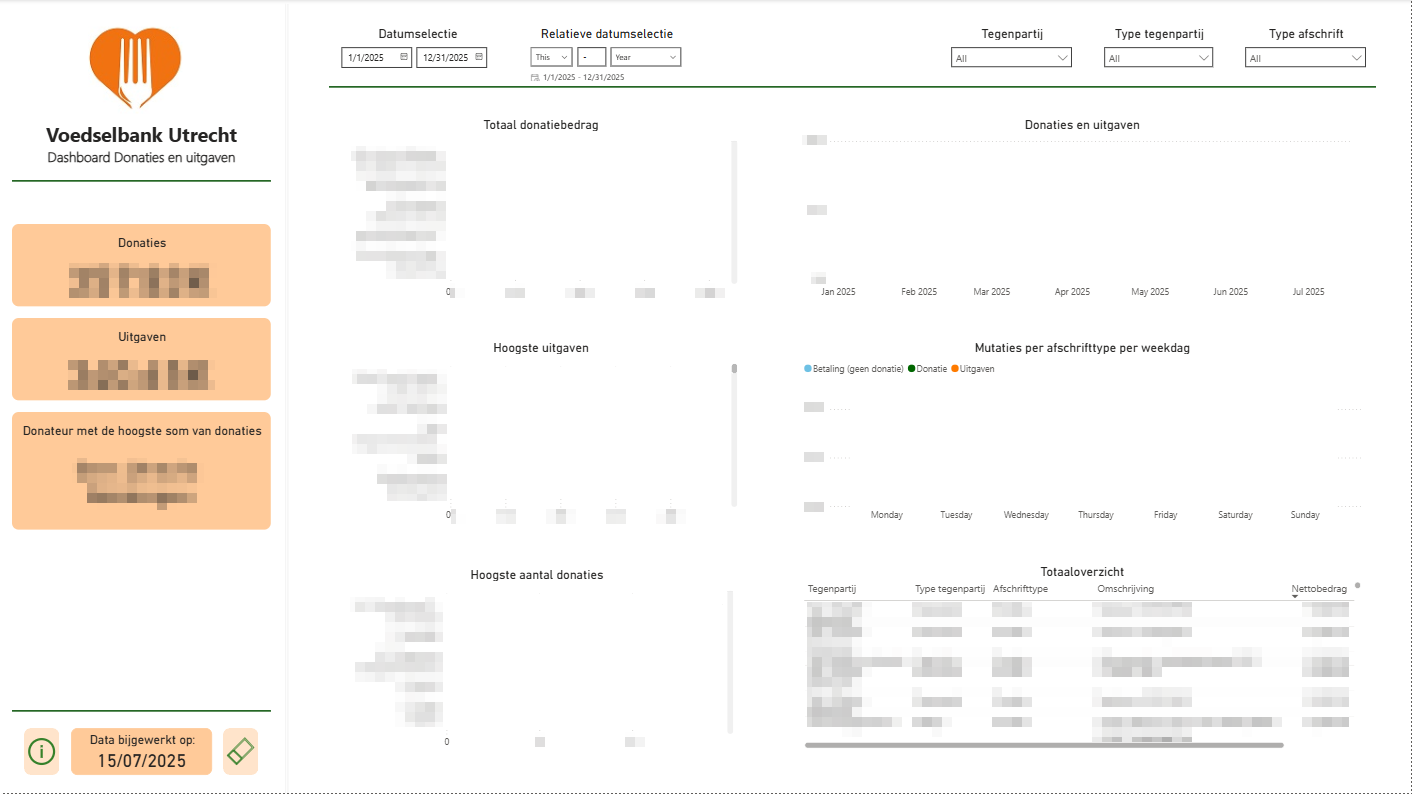
Result
A dashboard is not a one-off solution, but a tool that remains valuable only if it is regularly maintained and further developed. The focus now lies on active use of the dashboard. You can read more about this in our article ‘How to create a dashboard that keeps adding value?’
With this dashboard, Voedselbank Utrecht can continue expanding and deepening its insights, for example, by further segmenting target groups or connecting additional data sources. This way, the dashboard grows along with the organisation and remains a powerful tool for making social impact visible.
Creating impact together
Other non-profits can also benefit from data-driven insights.
Through our foundation, we support social organisations pro bono with data projects that make impact visible and strengthen it.
👉 Curious to see what we can do for your organisation?
Get in touch with us to explore how data can help strengthen your mission.
Want to know more about the Datahub?
Sanne is keen to discuss how we, as a data & AI partner, can support you and your organisation.
Account Manager Datahub datahub@digital-power.com
Want to know more about dashboarding?
Naomi will be happy to talk to you about what we can do for you and your organisation as a data partner.

Business Manager+31(0)20 308 43 90+31(0)6 29 52 69 63naomi.deboer@digital-power.com
Receive data insights, use cases and behind-the-scenes peeks once a month?
Sign up for our email list and stay 'up to data':
You might also like
Monthly Digital Insights – September 2026
In this monthly series, we share the latest trends, product updates and industry insights in AI, data and analytics that are most relevant to you. We look beyond the update itself and explain what these developments could mean for your organisation, where they may create opportunities and how you can turn them into value.
Which BI tools are most ready for AI?
Artificial intelligence is becoming a structural part of how you work with data. Predictive models, generative AI and automated decision support are no longer experiments. They can be part of daily operations. At some point, you reach a critical question: does your current BI setup still support where you want to go?
From dashboard to data-driven working: marketing team takes control of its own data
Retailer EyeCare Groep made the transition from an external to an internal marketing dashboard. This immediately served as the starting point for working more actively with data. Using a central dashboard as a basis, we guided the marketing team towards a new, data-driven way of working. As a result, data has become part of the conversation within the team, marketers can explore insights independently, and they can make decisions more quickly.
Answering data questions independently within minutes with conversational analytics
Within Digital Power, we wanted to give Finance and Business Support more ownership of management dashboards and give Sales faster, independent access to relevant insights. With a simpler data model and Databricks Genie, users can now ask questions about data in natural language and immediately ask follow-up questions. Finance and Business Support can also make dashboard changes themselves, reducing the amount of time technical specialists spend on recurring questions and changes.
Monthly Digital Insights – August 2026
In this monthly series, we share the latest trends, product updates and industry insights in AI, data and analytics that are most relevant to you. We look beyond the update itself and explain what these developments could mean for your organisation, where they may create opportunities and how you can turn them into value.
Monthly Digital Insights – July 2026
In this monthly series, we share the latest trends, product updates and industry insights that matter most to professionals in AI, data and analytics. We also share what these developments mean for organisations and where we see the biggest opportunities to create value.
How Databricks Genie Agents make data accessible through natural language
Many organisations face the same challenge. Someone has a question about revenue, customer behaviour or operational performance. The data exists, but finding the answer takes time. A dashboard needs to be opened, filters have to be configured correctly, or a Data Analyst needs to perform an additional analysis.
From sensor data to decisions that genuinely improve your operations
More and more organisations are investing in sensors that continuously collect data from their assets, whether buildings, vehicles, production facilities or energy infrastructure. The question is: what value does that data actually deliver?
Strengthening a data-driven mindset through tailored analytics training
Within Eneco’s Data Driven Marketing Chapter (around 60 colleagues), there was a growing need to better embed data-driven ways of working. The ambition was clear: not only data specialists, but also marketers and other teams should be able to perform analyses independently and make well-founded decisions.
Tealium Digital Velocity: AI is moving into production
For professionals in data, analytics, martech and customer experience, Digital Velocity is one of the events where developments become tangible. It brings together practitioners, partners and industry leaders to show how they approach AI, real-time data and customer experience in practice.
The FTG model for commercial organisations
When people think about the FTG model (function, task, behaviour), they often associate it with government websites. That makes sense. The model, developed by Toon Vuursteen, originated in a context where informing users was the primary goal and commercial objectives played no role.
Understanding website behaviour with GA4 and a central dashboard
Warmte voor de Kinderen is an ANBI charitable foundation that was established in 2003 at the initiative of heating wholesaler Rensa. The foundation is committed to giving children growing up in vulnerable circumstances a warmer future.
Gaining more control over AI initiatives with the support of an Analytics Translator
When the regular Analytics Translator of a service organisation went on maternity leave, the team sought our help to ensure ongoing AI projects ran smoothly. At the same time, the organisation wanted a fresh, external perspective: how was the role being filled, and where could improvements be made?
How the Analytics Translator brings data and business closer together
In many organisations, there is still a gap between the technical teams and the business. Data scientists and engineers build sophisticated models, while the business requires concrete insights that help make better decisions. The person who brings those worlds together? The Analytics Translator.
Work more efficiently through a Salesforce dashboard
Serve the City makes volunteering accessible by connecting volunteers with organisations and projects: from walking with the elderly to doing repairs in community centres. With Serve the City Young, the organisation focuses on young people, students, and schools. Larger projects are organised through schools, allowing young people to easily get involved in volunteering.
Webinar | Understand online behaviour with the FTG framework
Government websites are often the first point of contact between citizens and the government. Whether it concerns information about regulations, applications or participation, the digital experience determines how well citizens find their way around. But how do you know if your website is really doing what it should?
Power BI dashboard improves machine efficiency and reduces production costs
Essity is an international hygiene and health company active in more than 150 countries. It produces products such as tissues, incontinence solutions, medical items and nappies, under well-known brands including TENA, Libero and Lotus. The company has a strong focus on innovation and sustainability, aiming to improve people’s daily lives through its products.
From ambition to activation: how Ennatuurlijk really got moving with data
At energy company Ennatuurlijk, the belief grew that intuition was no longer enough to set the course. The energy market was changing rapidly, the organization was growing, and the amount of information was increasing every day. IT Manager Eric Vanderfeesten went looking for a data partner who could not only provide strategic advice on data-driven work, but could also strengthen his data team operationally. In this interview, he shares his vision, experience and results from working with Digital Power.
What is dbt Canvas? Self-service data modelling without SQL
dbt Canvas allows you to build data models through a visual interface, without writing SQL. With drag-and-drop functionality and AI support, Analysts can now independently build models and commit them to Git. This means that even less technical Analysts can contribute to the dbt codebase. Sounds like a gamechanger, but is it?
Is your organisation ready for independence from the US and migrate to EuroStack?
In an era marked by international tensions, rising concerns about privacy, security, and technological sovereignty, you may find yourself re-evaluating your reliance on US technology solutions. The drive towards digital independence isn't just a political goal, but may also be a pragmatic business necessity.
Transforming data into business value with insightful dashboards
With the right dashboards, you quickly extract valuable insights from your data. This allows you to make better choices and add immediate value to your organisation. In an interview with Consultancy.eu, Antonie van Velzen and Iga Jarosz explain how our dashboard solution helps you get a grip on your raw data.
More grip on web data thanks to smart tracking
The municipality of The Hague continuously works to improve its digital services. Citizens must be able to find their way quickly and easily on the online portal www.denhaag.nl and all linked environments. To improve that experience, good data is essential.
Third-party cookies: should I stay, or should I go?
In recent months there has been a lot to do about third-party cookies and their not-so-imminent-anymore end-of-life in the Google Chrome browser. Is this then much to do about nothing or should you brace yourself for a paradigm-changing shift? In this article we will lift the veil over this important topic. Also, we’ll share 7 hands-on tips to prepare yourself for what’s coming.
Greater control of government websites with the FTG framework
Government websites play a crucial role in providing information and services to citizens. But how do you measure the success of such a website? Here, many organisations choose the privacy-friendly Piwik PRO and Toon Vuursteen's data model: The FTG model (Functie [Function], Taak [Task], Gedrag [Behaviour]). This framework provides a structured method for understanding and improving the performance of a website.
How a start-up starts with data-driven working
An innovative start-up in the baby care sector aimed to work in a data-driven way in order to gain valuable insights and enable strategic growth. They engaged our support to help realise this ambition.
Maximise your impact with a user-friendly dashboard
Impact Matters connects business professionals to social issues of charities and foundations. In doing so, they ensure that the right need and expertise are brought together.
How do you create a dashboard that continues to add value?
It sounds simple: you regularly receive questions about a certain topic, so you decide to launch a dashboard to provide easy access to the answers. Usually, a great deal of time goes into creating these dashboards. You’ll find plenty of step-by-step guides online on how to build a good dashboard, but in the end, it’s often used far less than expected. Why does this happen—and more importantly: how can you ensure that you only build dashboards that are genuinely used?
From strategy to realisation: a data-driven future
Ennatuurlijk supplies sustainable heat and cold via heat networks to consumers and businesses. The internal Data & Analytics team is tasked with making the organisation data-driven. In doing so, they ran into a challenge: the many requests for data products within the organisation were difficult to manage and the impact remained limited. The management team therefore asked us to help them develop a data strategy, create a future-proof data landscape and drive a data-driven mindset within the organisation.
This is how you determine the KPIs that will make the difference
Key Performance Indicators or KPIs are indispensable to keep track of the performance in an organisation in a practical way. It is therefore important to choose the right KPIs and to keep a clear distinction between KPIs and PIs. In any case, KPIs must match the mission and vision of your company. In this article, Rogier explains how to determine your KPIs and shows you the most common mistakes.
Discrepancies in transaction figures: How and why?
"How many transactions did we have last week? Our back office reports 12,000 transactions, the database 15,000, and Google Analytics 11,000. Why don’t these numbers match?" In theory, systems tracking transactions should align. However, discrepancies are common across back-offices, databases, and web analytics tools.
Improved analyses through data standardisation and automation
Schiphol needed additional support in data management, so they reached out to Digital Power. We quickly realised that the data landscape was complex, with numerous event names and parameters. Each analysis required manual steps, such as unpacking and cleaning data. Linking different platforms, like app (iOS and Android) and web, presented a particular challenge, leading to a time-consuming and error-prone process with many repetitive tasks.
Optimised supply chain performance visibility with Tableau
PACCAR Parts Europe (PPE), a sister company of DAF Trucks, is responsible for supplying truck parts to all DAF Trucks dealers across Europe. To achieve this, PPE operates a sophisticated supply chain network throughout Europe. Currently, PPE is developing a Supply Chain Control Tower—a platform that provides full transparency of all logistical movements from supplier to dealer.
How to centralise Google Analytics 4 data to gain valuable insights
Is your web data not fully usable for your Data Analysts? Discover how Analytics Engineers, with their background in web analysis and technical expertise, bridge the gap between technology and business. Centralise your Google Analytics 4 data and enable your entire organisation to quickly and efficiently extract valuable insights.
The impact of ITP on analytics and the user experience
Intelligent Tracking Prevention (ITP) was launched by Apple in 2017 in an effort to restore "the balance the balance between privacy and the need for on-device data storage". With Intelligent Tracking Prevention, Apple aims to reduce cross-site tracking (following users across websites) by limiting the use of cookies. Find out what this means for you.
20% fewer complaints thanks to data-driven maintenance reports
An essential part of Otis's business operations is the maintenance of their elevators. To time this effectively and proactively inform customers about the status of their elevator, Otis wanted to implement continuous monitoring. They saw great potential in predictive maintenance and remote maintenance.
Implementation of e-commerce tracking for Google Analytics 4
MS Mode & America Today used Universal Analytics (UA) for analysing their online stores. They had fully implemented e-commerce tracking, with KPIs such as transactions, average order value, and abandoned shopping carts visualised in Looker Studio.
Transitioning from Universal Analytics 360 to Google Analytics 4 and Streamlining Data Analysis
There are currently a lot of developments surrounding Google Analytics, including user privacy (GDPR) and the sunset of Universal Analytics. For Miele X, the digital branch of Miele, GA4 was also one of the topics on their agenda as part of their bigger plans towards a more privacy-centric and vendor-agnostic way of data collection. They enlisted our help to support them with the transition from Universal Analytics 360 to GA4.
Optimisation of marketing activities through an integrated dashboard
Valk Digital, an internet company, aimed to adopt a more data-driven approach. The marketing team was already discussing all the data weekly using an Excel spreadsheet, but due to manual data input, it was time-consuming and more likely to fail. There was a need for an automated, future-proof approach based on reliable data.
Which analysis and visualisation tools are available?
To make informed decisions, insights into your business performance are essential. Various analysis and visualisation tools are available to assist you. The best tool for your company depends on your specific needs. In this blog, we discuss the pros and cons of 6 popular tools: Google Analytics, Adobe Analytics, Piwik PRO, PowerBI, Looker Studio, and Tableau.
Insights into market dynamics for a stronger competitive position
FrieslandCampina Global facilitates local teams in Europe, Asia, and Africa. They want to gain a better understanding of the market and provide the teams with new insights. The goals are to strengthen their competitive position and to identify new opportunities for expansion.
How do you collect data while protecting the privacy of EU citizens?
The world of web analytics is constantly changing due to technological and legal developments. One significant event in the field of technical web analytics is the introduction of server-side tracking, which allows companies to have full control over their data flows.
Unlocking the power of Analytics Engineering
The world of data is continuously shifting and so are its corresponding jobs and responsibilities within data teams. With this, an up-and-coming role appeared on the horizon: the Analytics Engineer.
Securing historical data of Universal Analytics using the Google Reporting API
As of 1 July 2023, Google Universal Analytics (UA or GA3) will stop processing data. More and more companies are therefore transitioning to GA4. Unfortunately, historical data from GA3 is not visible in GA4, and if you don't want to lose the data, you must extract everything from UA before 1 July 2024. After that, it will no longer be possible.
Switching from Universal Analytics to Google Analytics 4 (GA4)
On 14 October 2020, Google launched the new version of Analytics: Google Analytics 4 (GA4). Soon after the launch, it became clear that a number of important functionalities from Universal Analytics (GA3) were missing, and therefore the time to switch seemed far away. Fortunately, we see that the development team on the side of Google has not been idle. Some nice features have since been introduced within GA4 that have narrowed the gap between GA3 and GA4. This article answers the questions that are increasingly being asked about GA4.
Google Analytics 4 vs. Google Analytics 3: What are the pros and cons?
If you want to keep track of free statistics about website visitors and their behaviour on your website, you will quickly turn to Google Analytics. With the free version of Universal Analytics (better known as GA3), it only takes a few minutes to set up basic metrics such as users, sessions and pageviews. For more extensive analyses, you have the paid version Google Analytics 360. As of July 2023, GA3 will no longer be supported by Google. Time to switch to the new GA4. Read all about the pros and cons of the new Google Analytics in this article.
Five questions for Data Analyst Dennis
In this video, you will find out what a job as a Data Analyst looks like! What does a working week look like, which clients do our Data Analysts work for and what makes working so much fun? Dennis likes to tell you more about it!
What to do about broken Looker Studio dashboards?
Did the following scenario happen to you last week? While enjoying your morning coffee, you take a look at your pride and joy: a meticulously created Looker Studio dashboard built with the GA4 connector. You rub the sleep from your eyes and see your charts are all broken. Frantic phone calls from colleagues are pouring in. What is happening? Find out in this post what the consequences of Google’s newly imposed quota on the Google Analytics Data API are.
Insight into Google Analytics 4 data
The end date for using Universal Analytics is getting closer and closer. Many companies have been collecting data in Google Analytics 4 (hereafter; GA4) for some time now. The next step is to visualise GA4 data in the right way. This process raises new questions. "When do I visualise my data in GA4 explore?" and "How do I deal with the quota limits for Looker Studio if I want to make GA4 data insightful?". Our decision tree will help you make the right choices.
Working as a Data Analyst
What does a position as a Data Analyst look like in practice? What kind of work do you do? And what skills do you need? Jelmer, a Data Analyst at Digital Power, tells us more about this in the 'From data to action' podcast! Listen to the podcast or read it in the article below.
EP 2: Almost graduated and ready for your first job as a data professional?
How do you find out what you want, and what do you look for in job vacancies? Will you opt for a big or small company, consultancy firm or something else? These are some of the questions that our graduation intern Stijn had to face. He entered into discussions with his colleagues to find answers to these questions. The result? The Data Choice Cast! In this podcast, Stijn asks all his pressing questions and receives tips that help him (and hopefully you, too) to make the right choice for a job in the data world.
Collecting reliable data in 6 steps
"There are three kinds of lies: lies, blatant lies, and statistics," said former UK Prime Minister Benjamin Disraeli. This also often applies to the use of data, because you cannot blindly trust data if you do not know the background.
Making impact measurable
The Designathon Works foundation organises Design Hackathons (Designathons) for children aged 8 to 12. The target? Teaching children from all over the world skills to become a 'changemaker'. They are challenged to design solutions for a better world, for example to combat climate change. From the Datahub, we helped Designathon Works fine-tune the impact measurements free of charge. We also made a first move towards automating data collection, analysis and visualisation.
A well-organised data infrastructure
FysioHolland is an umbrella organisation for physiotherapists in the Netherlands. A central service team relieves therapists of additional work, so that they can mainly focus on providing the best care. In addition to organic growth, FysioHolland is connecting new practices to the organisation. Each of these has its own systems, work processes and treatment codes. This has made FysioHolland's data management large and complex.
Data-driven website optimisation
The well-known Dutch band HAEVN was unable to perform due to the corona measures. In order to make the most of their time, they wanted to optimise their new website and webshop. They sell merchandise, CDs and LPs through their Shopify webshop. Fans can also download concert films there. The HAEVN team themselves had little knowledge of data-driven website optimisation and asked us for help.
What are cookies?
Cookies. This word comes up a lot in the world of marketing and online analytics. But what exactly are those cookies? And are there different types of cookies?
The COVID-19 Violence Tracker
The outbreak of the corona pandemic in early 2020 has turned the world upside down. In addition to countless infections, hospitalisations and deaths, we also saw an outbreak of violence in many countries. Citizens took to the streets, sometimes violently, to protest against the measures taken, but domestic violence also increased in many places and fear and frustration played a role in racism.
Data-driven work in a crisis organisation
Dienst Testen is a crisis organisation created during the corona pandemic. Under the banner of the Ministry of Health, Welfare and Sport (VWS), Dienst Testen ensures that everyone in the Netherlands can be tested quickly and reliably. Dienst Testen does this in collaboration with the municipal health services (GGDs) and laboratories. To quickly gain insight into the corona test figures in the Netherlands, Dienst Testen asked us and a number of other data consultancy parties to create dashboards in collaboration.
Provide insight into cross-sell and upsell opportunities
KPN's Team Digital wondered whether more value could be gained from their existing customers. Using the available data, we looked at where – within the existing online customer journeys – there were opportunities for cross-selling and upsell.
Data-driven optimisation of offline customer service
For some time now, we have been assisting PostNL's customer service department with the optimisation of their online service & contact environment. Various pilots showed that there was also a lot of potential in improving the offline service.
What is data-driven working?
In our field we are regularly asked whether we want to help organsations to work data-driven. To answer and help with this, it is important to understand how we look at the explanation of data-driven working. At Digital Power, we assume that data-driven working is equivalent to making decisions based on data. Although this may seem like a simple description, there is much more to it!
Achieve more conversions with CRO
Whereas conversion rate optimisation (CRO) used to be mainly in the E-commerce focus, we now see its application in all kinds of forms and fields. The focus here is on improving a particular conversion goal. Whatever your goal is for your organisation or team, CRO requires a good approach. This e-book will help you get started.
From data to action
Every day, we collect data. Think of customer data, website visitor behaviour, information about conversions through all your off- and online channels and the performance of different teams within your organisation. But how do you use that data effectively?
Monitoring BigQuery costs
If you use BigQuery, whether or not in combination with Google Data Studio, it is useful to keep track of your query costs. You also want to know which queries contribute the most to this. In this article we explain how your BiqQuery costs are generated and how you manage them as efficiently as possible.
Better service with the help of data
The Municipality of Utrecht collects a lot of data from contact moments with citizens. This includes anonymous visitor behaviour on the website and online applications, but also phone calls to the Customer Contact Center, messages via webcare and physical appointments at the municipal desk.
Route to data-driven (co-)working
DIGIWEDO specialises in designing and developing responsive websites, web shops and web applications for SMEs (MKB). They regularly receive questions from customers about how to collect, visualise and/or analyse data in the right way. DIGIWEDO does not yet offer any services in the field of data. They asked us to think about how they could expand their existing services when it comes to advice in the field of data-driven working. Within a week, using our data pressure cooker we proposed a clear plan that helps DIGIWEDO to meet customer needs.
The importance of data quality
Are you going to make decisions based on data? Then you have to ensure that your data quality is in order. Good documentation according to a clear process is essential here. Why and how? You can read it in this article.
Data-driven web and customer experience optimisation
Eneco customers can enter into or change an energy contract via the website, but also purchase a charging station or hire an energy coach, for example. Eneco wanted to bring in more expertise regarding the field of digital analytics. We helped Eneco find an extra Web analyst with whom this ambition could be fulfilled.
The corona dashboard of the RIVM
Our team follows the news about the corona dashboard of the Dutch National Institute for Public Health and the Environment (RIVM) with great interest. Creating such a dashboard is quite easy if the data is available. But how do you analyse and interpret it? Our Data Analysts will explain it to you.
From data to action for public services
There's no denying it. We all work with data and we generate huge amounts of new data every day. The data on our supermarket customer card, the disposal of household waste at the smart container, checking in with public transport, the number of hours our TV is on or refilling our parking meter. But how do you use that data effectively?
Clear dashboards for the IC team during the Corona crisis
In times of the coronavirus (COVID-19), a good overview of the patients in the scaled-up intensive care of the Utrecht medical centre is vital. Employees must be able to view patient characteristics, the most current lab readings and the course of patients' vital signs at a glance. In addition, up-to-date insight into the bed occupancy per department and the capacity of the nursing staff is required. We immediately got started to provide the necessary insights for UMC Utrecht. As a way of also contributing in these times of crisis, we offered our hours free of charge.
A new tagging structure for the App and website
Univé is the only Dutch insurer with a website, App and physical stores. They therefore follow an omni-channel strategy. According to its own '1 digital front door principle', the insurer also wanted to offer customers the opportunity to take out/change insurance policies and report damages via the App. They asked our Data Analysts to make the new funnels measurable.
Effective data-driven working
On the one hand, large amounts of available data are wonderful: after all, you can learn a lot from it. In practice, however, many organisations collect much more data than necessary. They often have so much information that they don't know what to look for. Or relevant data is actually collected, but it is not used optimally as input for decisions.
Data training at the Digital Power Data Academy
Venturn's consultants are active in the maritime and logistics sectors. The service provider itself organises soft skills training for their employees. In addition, there was a need for training in the field of data-driven work. Venturn asked us to develop tailor-made data training.
The proven added value for Fietsvoordeelshop
Fietsvoordeelshop has seven physical stores and a webshop. It is one of the most successful bike shops at the moment. In the field of data, the bicycle shop mainly worked with Excel. This means that a lot was done manually, every week. Due to the growth of the organisation and the increasing number of processes, the Excel file became increasingly large and unclear. Fietsvoordeelshop asked us to demonstrate with a data pressure cooker of five days that data-driven work could be of added value.
Responsible data collection and processing
From 'ethical data to doing' is easier said than done. Some of the ethical considerations in the field of working with data are laid down in the Privacy Act (GDPR). Depending on the context, there are many more questions to ask ourselves. If something is legal, this does not automatically mean that it is also ethically responsible.
Analysis of ratings and reviews of the Philips Hue app
The Internet of Things (IoT) system from Philips Hue, part of lighting manufacturer Signify, includes a mobile app. This allows end users to control their smart-home lamps both locally and remotely. They rate their experiences with the mobile app and the rest of the IoT system via Google Play or the App Store. Due to the large number of ratings and reviews, it is time-consuming to analyse them manually and recognise recurring themes.
What is data analytics?
Every company collects data. But what exactly is data analytics? Why do companies collect data? Why are they investing in data analytics? And what can you do with it yourself? Let us explain.
The Data Analyst as a promoter of a data-driven organisation
Data analysis leads to clear, action-oriented insights that ensure the right decisions are made. At least, that's how it should go. To the frustration of many Data Analysts, they view carefully presented insights but little reflected in concrete actions.
Step by step data-driven working with the Digital Power Building Blocks model.
RetailTrends is a family business with a media platform for retailers. Over the years, the company has developed from a publisher of a single print magazine to a multimedia platform. This consists of two websites with news and background articles about the industry; a print magazine; an online magazine; and events. Interested parties are kept informed via various newsletters and social media channels. Some of the content is only accessible to members.
Digital transformation for cross-channel customer experience using data.
The Van Gogh Museum is the most visited museum in the Netherlands. More than 2.2 million people visited the museum in 2017. Data is collected from all those people. Data from the website and other online marketing channels, but also offline data from ticket sales at the box office, for example.
A comprehensive understanding of the customer journey with Google Analytics and R
ONE Business websites allow users to buy subscriptions to various magazines. The online sales funnel can hereby be dynamically divided for each offer. For example, it is possible to give users free term choices or to limit them to a specific offer. Because the sales funnel is dynamic, it is impossible with the standard Google Analytics implementation to gain good insight into the customer journey. ONE Business asked us to provide insight into where people opt out and why. This will enable them to optimise the funnel for more online conversions.
Storytelling using data
Organisations collect as much data as possible to map out the Customer Journey. After analysis, this combination of quantitative and qualitative data provides insight into the what and why of customers or visitors. These insights should prompt action. It is important to communicate the insights well, so that the right actions are taken. You can do that with storytelling.
More reach, engagement and online conversion thanks to insights from online content dashboards
Elsevierweekblad.nl is an online platform with news, opinion and background information. Various authors write articles on a variety of relevant topics on a daily basis. Elsevier Weekblad wanted to get a better grip on the content formula behind this. This required insight into the extent to which the types of content contribute to reach, engagement and sales of subscriptions.
Call reduction thanks to digitisation of customer service
'How do we reduce the number of calls to customer service asking: where is my package?' During a Learning @ Location Day, our multi-disciplinary team of data professionals worked on this PostNL challenge.
More relevant insights from Google Analytics
'How do we extract more relevant insights from our data using Google Analytics?' During a Learning @ Location Day, our multi-disciplinary team of data professionals worked on this Nespresso challenge.
Streamlining web development using a tag management plan
To have a good overview of the results of multiple websites at the same time, you need a clear structure as a basis. RNW Media has several project websites, some of which are available in different languages. Our own web development team is responsible for the build and maintenance of this. They set to work with a building block model for building new websites. We were asked to provide a structural solution for measuring all websites.
Increased ROI in healthcare campaign thanks to improved insight
Various departments within Univé made decisions based on data from multiple data sources and separate reports. As a result, each department made decisions based on different information. The departments were also not always aware of each other's performance. We investigated how the integration of the data sources using the Microsoft Power BI visualisation tool could improve decision-making.