Which analysis and visualisation tools are available?
Advantages and disadvantages of the most commonly used tools

To make informed decisions, insights into your business performance are essential. Various analysis and visualisation tools are available to assist you. The best tool for your company depends on your specific needs. In this blog, we discuss the pros and cons of 6 popular tools: Google Analytics, Adobe Analytics, Piwik PRO, PowerBI, Looker Studio, and Tableau.
We can assist you with tool selection, implementation, and optimisation. We also offer user training to ensure effective use of the chosen tool.
Analysis tools
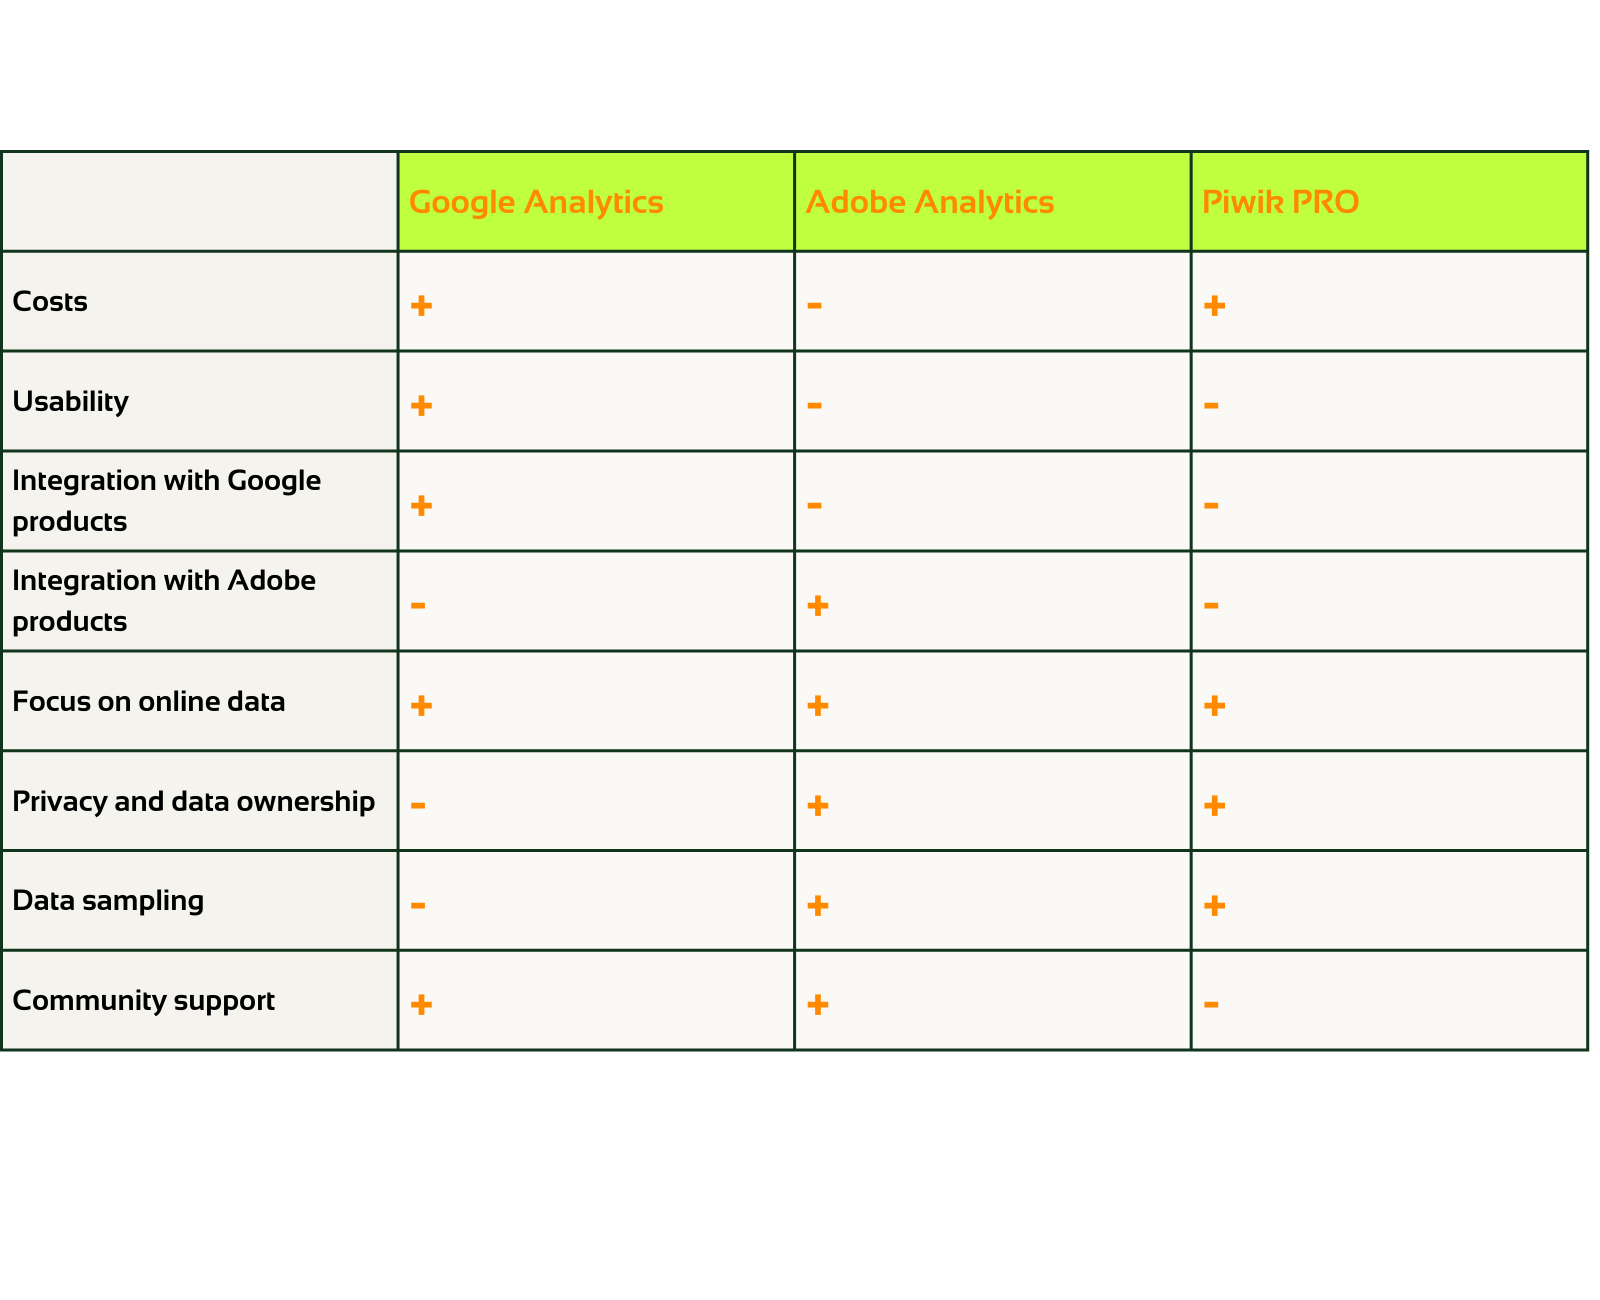
Google Analytics 4:
Google Analytics 4 is a web analytics tool developed by Google. The tool provides insights into the behaviour of your users on websites and apps. This way, you can measure and optimise the performance of your online channels.
Pros:
- Cost-effective: GA4 offers a free version with essential features, making it an affordable option for businesses with a limited budget. There is also a paid version with more advanced features.
- User-friendly: Known for its accessible interface, suitable for users with limited analysis experience.
- Integration with Google products: Seamlessly integrates with other Google products, such as Goole Asd, Goole Search Console, and Google Looker Studio. This allows you to easily analyse data on multiple Google platforms.
Cons:
- Focus on online data: Primarily designed for web and app analysis, less suitable for other data types.
- Privacy and data ownership: Data stored on Google servers may raise privacy and data ownership concerns. Read how to ensure user privacy here.
- Limited advanced features: Lacks the extensive analysis capabilities of tools like Adobe Analytics.
- Data sampling: It may happen that data sampling takes place in GA4. This means that a random subset of data is selected and not 100% of the data is used. Read here more about data sampling in GA4.
Adobe Analytics:
Adobe Analytics is part of the Adobe Experience Cloud suite and provides insights into online and offline customer interactions.
Pros:
- Advanced features: Offers comprehensive tracking of customer interactions across various channels, online and offline.
- Integration with Adobe products: Smoothly integrates with Adobe Experience Manager and Adobe Campaign.
- Data control and privacy: Provides greater control over data ownership and privacy compared to Google Analytics.
Cons:
- Cost: Unlike Google Analytics, Adobe Analytics does not offer a free version. This means that it relatively brings higher costs.
- User complexity: The implementation and use of the tool require more expertise. Interested in taking a training on Adobe Analytics? Check out our training here.
Piwik PRO:
Piwik PRO helps you with tracking, analysing, and reporting data about the behavior of your users on your website. Piwik Pro has three main modules:
- Piwik Pro Analytics - offers an extensive set of web analytics features
- Piwik Pro Consent Manager - helps to comply with GDPR regulations. It allows your website visitors to have full control over which data is collected
- Piwik Pro Tag Manager - offers a user-friendly interface that makes tag implementation on the website easier
Pros:
- Data privacy: Piwik PRO is a European product and is GDPR-proof. All servers are located in the EU and no data is stored outside the EU. In addition, it offers other privacy features, including on-premises data hosting. This is especially important if you collect privacy-sensitive data, for example, if you work for a government organisation.
- Reporting capabilities: you can create reports and dashboards based on specific needs, such as user behaviour, conversion analysis, campaign performance, or another specific goal. This allows you to visualise and analyse the most relevant data.
- Advanced features: it is possible to perform advanced analyses, such as funnels, goals, segmentation, and cohort analysis.
Cons:
- User-friendliness: Less intuitive than Google Analytics or Adobe Analytics.
- Limited community support and documentation.
Visualisation tools
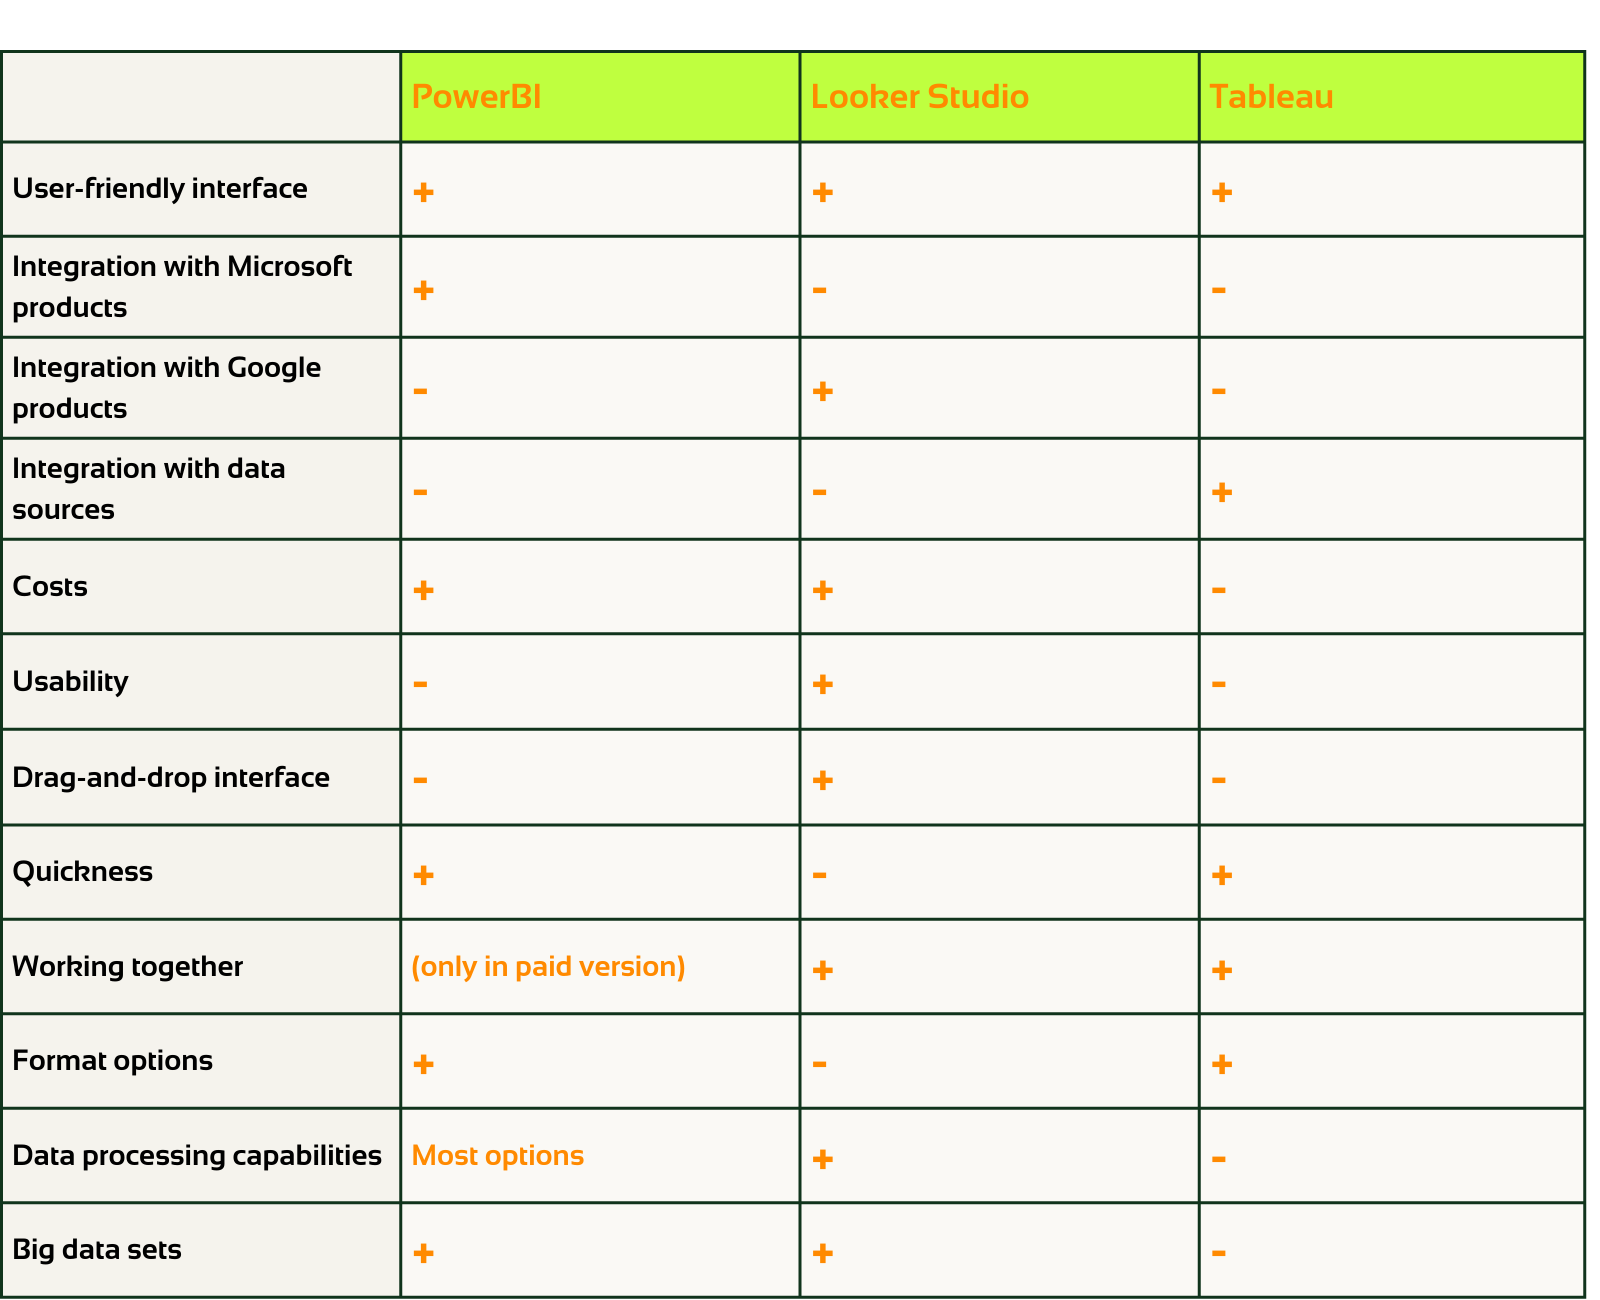
PowerBI:
Power BI is a visualisation tool developed by Microsoft.
Pros:
- User-friendly interface: Power BI has a user-friendly interface, so you can easily import data, create reports, and design interactive dashboards. You don't need extensive technical knowledge to get started.
- Integration with Microsoft products: Power BI is part of the Microsoft ecosystem, so you can seamlessly integrate it with other Microsoft products, such as Excel, SharePoint, and Azure. This makes it easy to collaborate on reports and dashboards.
- Advanced features: Power BI has a variety of advanced features, including:
- Data Analysis Expressions (DAX): DAX is a formula language in Power BI that you can use to create custom measures and calculations.
- Data modeling: Power BI allows you to create data models that can be used to analyse data from different sources.
- Data transformation: Power BI allows you to transform data from different sources to make it easier to analyse.
- Cost: Power BI is free for personal use, but there are paid plans for businesses and organisations.
Cons:
- Learning curve: Power BI has a steep learning curve, so it may take some time to get the hang of the advanced features.
- Limited data processing capabilities: Power BI is not as powerful as some other data processing tools, so it may not be suitable for large datasets or complex calculations.
Looker Studio:
Looker Studio is a visualisation tool developed by Google.
Pros:
- User-friendly interface: Looker Studio has a user-friendly interface, so you can easily create reports and dashboards.
- Integration with Google products: Looker Studio is integrated with other Google products, such as Google Ads, Google Search Console, and Google Analytics. This makes it easy to analyse data from different sources.
- Advanced features: Looker Studio has a variety of advanced features, including:
- Customisation: Looker Studio allows you to customise reports and dashboards to meet your specific needs.
- Collaboration: Looker Studio allows you to collaborate with others on reports and dashboards.
- Cost: Looker Studio is free for personal use, but there are paid plans for businesses and organisations.
Cons:
- Advanced features: The tool offers limited data processing and advanced analysis capabilities compared to dedicated data analysis tools. For complex data transformations and advanced analysis, you will need additional tools and methods.
- Learning curve: Looker Studio has a steep learning curve, so it may take some time to get the hang of the advanced features.
- Limited data processing capabilities: Looker Studio is not as powerful as some other data processing tools, so it may not be suitable for large datasets or complex calculations.
Tableau:
Tableau is a visualisation tool that provides a variety of features for data visualisation and business intelligence.
Pros:
- User-friendly interface: Tableau has a user-friendly interface, so you can easily create reports and dashboards.
- Speed: Tableau uses in-memory technology, which means that it loads data into the computer's memory, rather than on a hard drive or other storage device. This makes it quick and easy to access and process data.
- Data connections: Tableau can connect to a variety of data sources, including spreadsheets, databases, cloud storage, and big data solutions. This makes it easy to combine data from different sources and visualise it in one dashboard.
- Advanced features: Tableau has a variety of advanced features, including:
- Complex calculations: Tableau allows you to perform complex calculations on data.
- Parameters: Tableau allows you to set parameters on data, which can be used to create custom reports and dashboards.
- Map functionality: Tableau allows you to add map functionality to reports and dashboards.
- Collaboration: Tableau allows you to collaborate with others on reports and dashboards.
- Cost: Tableau is a paid tool, but there are different plans available to meet the needs of businesses and organisations.
Cons:
- Learning curve: Tableau has a steep learning curve, so it may take some time to get the hang of the advanced features.
- Data processing capabilities: Tableau is not as powerful as some other data processing tools, so it may not be suitable for large datasets or complex calculations.
- Limited customisation options: Tableau has limited customisation options, so you may not be able to create reports and dashboards that meet your specific needs.
The right tool for your organisation
Besides these 6 popular tools, there are many others on the market. All tools have valuable elements. The tool most suitable for your company depends on your needs and the size of the organisation. We will be happy to help you choose the right tool.
Do you need support with your data analysis or do you have another data challenge? Our data specialists will be happy to help you gain valuable insights and make data-driven decisions.
This is an article by Irene Stolk, Digital Marketer at Digital Power
Irene Stolk is a Digital Marketer with a passion for data. Her analytical skills enable her to leverage valuable insights for campaigns. She thrives on writing blogs, client cases, and interviews, fueling her energy and creativity.
Receive data insights, use cases and behind-the-scenes peeks once a month?
Sign up for our email list and stay 'up to data':