What to do about broken Looker Studio dashboards?
Our suggestions for overcoming Google’s newly imposed quota on the Looker Studio GA4 connector
- Article
- Technical Web Analytics
- Data Analytics


Did the following scenario happen to you last week? While enjoying your morning coffee, you take a look at your pride and joy: a meticulously created Looker Studio dashboard built with the GA4 connector. You rub the sleep from your eyes and see your charts are all broken. Frantic phone calls from colleagues are pouring in. What is happening? Find out in this post what the consequences of Google’s newly imposed quota on the Google Analytics Data API are.
Updated May 2023: GA4 loosened many of the GA4 Reporting API token limits.
What has happened?
On November 10, 2022, the release notes for Looker Studio (formerly Google Data Studio) were updated. In the notes, it was announced that there would be quotas enforced for Looker Studio reports. Within days of this announcement being made, we noticed multiple clients losing practically all functionality in Looker Studio reports using the GA4 connector.
Google has simultaneously introduced two quota: 1) how many times dashboard users can simultaneously query the Google Analytics Data API and 2) how much data you can request from your Google Analytics 4 property per hour and per day.
What does this mean in practice? Let’s assume you have a Looker Studio report with 6 charts on a page and it is being used by two colleagues at the same time. The number of requests will be 12 (=6*2) which exceeds 10; as a result the charts will not be loaded and you will be shown an error message that reads ‘Exhausted concurrent requests quota’.
Apart from the request quota mentioned above, there is also a token quota set on both an hourly and daily basis. This quota limits the number of actions users perform within the dashboard (e.g. applying filters, sorting tables, changing date range etc.). Once your tokens are used up your charts will return an error.
On Wednesday 10 May, many of the GA4 Reporting API token limits were loosened. In practice, this will mean that small and mid-size companies with standard properties can regain functionality over some dashboards. Very large dashboards that are used simultaneously by multiple colleagues will most likely continue showing errors.
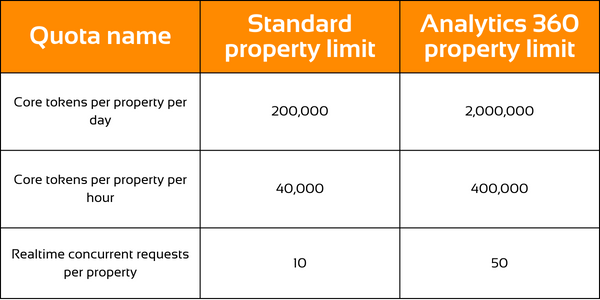
The following table shows the exact limit for all types of quotas as of 10 May:
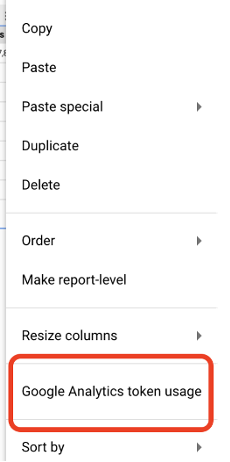
A couple weeks after announcing the quota, Google has included a token usage monitor in Looker Studio. This functionality can be accessed while being in edit mode.
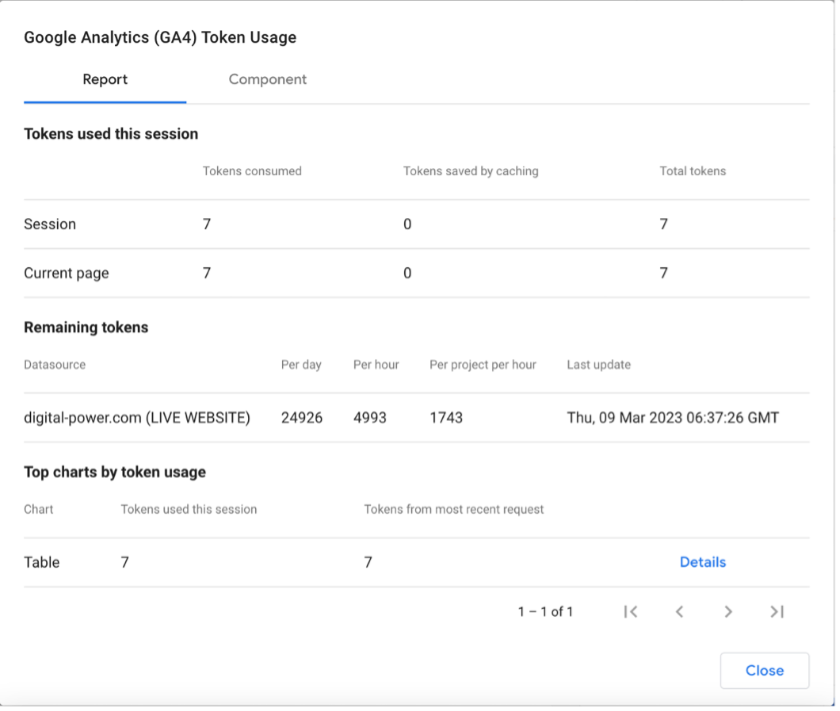
When opening the panel you will gain insights on token consumption on report and component level. Keep in mind that this overview only displays core tokens consumption and that it does not show information on the concurrent requests the API is receiving. This panel will give you a straightforward view on whether continuing using the GA4 connector within the reality of quotas is still feasible.
By looking at the ‘Remaining Tokens’ information you can determine whether your team member’s need for insights are exceeding the quota set by the API. The ‘Top charts by token usage’ will give you an idea of how resource-intensive your dashboard is.
You can reduce the number of tokens consumed per chart by reducing the number of rows and columns, using simple filters or reporting on a shorter date range. Naturally you will arrive at a point where reducing the reporting scope is defeating the purpose of the dashboard. For these situations it is worth reading our recommendations for alternatives further in this post.
Who is impacted?
Firstly we would like to stress that the quota is currently only enforced on data being pulled into Looker Studio from GA4 properties. If your Looker Studio reports are still connected to Universal Analytics you will not be impacted by the quota. This unfortunately does not mean that you can lay back and watch GA4 dashboard owners tear their hair out. After all, Universal Analytics is an end-of-life product and data collection for standard properties will be cut off on July 1, 2023 (those using Analytics 360 properties can benefit from the extended grace period and have one extra year). You do however have some time to think about alternatives for the Looker Studio GA4 connector.
Secondly, we should ask ourselves the question of whether GA360 users can still confidently rely on the Looker Studio GA4 connector. After all, paying a minimum of $50,000 a year for the licence gets you 10 times as many tokens than free users have. The answer unfortunately is ambiguous. Small and medium sized users of the tool are probably going to be ok while larger sized users will experience the same issues as free users.
Take the scenario described below. Do you find your company’s situation to be similar to the picture painted below? If so, being a GA360 client will not be your saving grace and you will run into quota issues.
If your business has:
- 5 hourly Looker Studio users
- Each of whom view about 3 pages
- With an average of 10 charts on each page
- And use a filter approximately 5 times while browsing the dashboard
- Assuming the average cost is 20 tokens per data request
- You are already looking at 15K tokens an hour which is well over the 360 limit.
Update: With the 10 May updates to the GA4 Reporting API limits, the dashboard was able to retain its functionality in the above scenario. You still need to watch out for the concurrent request limit, which can be problematic if the dashboard page contains more than 10 images.
To summarise: almost everyone using GA4 will be impacted by the newly imposed quota. Only if your business falls in a very specific category (e.g. small/medium-sized company with GA360 license) you might not be impacted.
It is important that you take time to think about sustainable alternatives that in the future will not only preserve your current level of reporting but might even allow you to improve your dashboards.
What alternatives are available?
We’ve split the alternatives into short, medium, and long term solutions.
Short term solutions (next 4-8 weeks)
Use GA4 Explorations
One of the major perks of GA4 is its Exploration module. Although the functionality of this tool is far below what Looker Studio has to offer, it could make for a decent fall-back option in times of need. The major constraints here are that the date range cannot be larger than 90 days, there might be cardinality issues and shared reports cannot be modified by anyone but their owner.
Sheets add-on for Google Analytics / Supermetrics
The Google sheets add-on is free to use and allows you to pull your Analytics data through the Google Analytics API. You could schedule a query to run on a daily basis which in most cases should clear you from data sampling/quota restraints. The sheet that contains the Google Analytics output can then be used as a data source for Looker Studio. In this scenario the Looker Studio GA4 connector will not be involved, thus you will no longer run into the quota issue.
In the long term, there will be sustainability issues with this solution as spreadsheets can become unwieldy when they contain large amounts of data.
Create lean Looker Studio dashboards with the GA4 Reporting API (per May 2023)
The newly imposed limits allow much more functionality for dashboarders using the Reporting API. Dashboards with a limited amount of visuals and a modest number of users should now be working reliably again. Check token usage to ensure your dashboard does not exceed the newly imposed limits.
Medium term solutions (next 8 – 52 weeks)
Get Google Bigquery up and running
Bigquery is Google’s data warehouse solution which is (among other things) designed to store your GA4 property’s raw data. The sky becomes the limit when GA360 is combined with Bigquery. If you are using the free version of Google Analytics 4, the number of events that you can send daily to Bigquery is capped at one million. Both as a free or enterprise user of Google Analytics 4 you can enjoy an unlimited amount of data storage and run as many queries as you like. Setting up the Bigquery integration for Google Analytics 4 is very easy and can be done directly from the GA4 admin panel.
So why is not everyone already using Google Bigquery for their Google Analytics 4 properties? For one, the service comes at a cost. Google will charge users for storing their data as well as running queries on the service. Another hurdle is that to get something out of Bigquery you need to be able to write SQL commands. It is likely that companies lack the in-house capacity to carry out this task. We have the capacity and the expertise to assist your company with this.
The cost component should not be seen as a deterrent for using Bigquery. When thoughtfully setting up your data source tables, you will be able to run large dashboards that load much faster than anything you could expect from the Looker Studio Google Analytics 4 connector for a reasonable cost. On the other hand, you could find yourself running up a massive bill if you make mistakes in your set-up.
A final thought on Google Bigquery is that once set up it frees you of the obligation of using Looker Studio. A Bigquery source table can just as easily be connected to a Microsoft Power BI dashboard (or any other BI tool for that matter).
Not sure how to start with Google Bigquery? We would love to think along with you and choose the best possible set-up.
Long term solutions (>1 year)
As the impact of the recent changes is starting to sink in, it becomes apparent that the group of Google Analytics 4 users that see their needs met with the free version is shrinking fast. In the long term this will leave you with two major options:
Purchase a GA360 license
If you are determined to stay in the Google stack, upgrading to GA360 for the sake of acquiring more Looker Studio tokens makes little sense. More likely, you’ll want to upgrade due to the Google imposed event cap on Bigquery streaming (one million events a day). On a large traffic volume website with many measurements implemented, this cap might quickly prove problematic. In such a case you are left with few alternatives then to upgrade to GA360.
Nowadays pricing for GA360 is no longer based on a fixed rate but instead is dependent on the volume of your event collection. According to Google, you will be looking at a price of $50,000 per year for collecting about 25 million events per month.
In return for the license fee, you will get more tokens to use in Looker Studio as well as access to unsampled GA4 explorations.
Consider alternatives to Google Analytics
Google Analytics has been the market leader in the Web Analytics industry for many years. However, there are competitors out there who might also deliver great value for your business. One of Google’s main advantages over its competitors was that they offered a great product for free that had many awesome plug-and-play applications. With GA4 it is becoming apparent that free users are getting fewer perks and more hassles on their path.
We are tool agnostic which allows us to look together with you for the tool that can deliver the greatest value to your business.
Receive data insights, use cases and behind-the-scenes peeks once a month?
Sign up for our email list and stay 'up to data':