Securing historical data of Universal Analytics using the Google Reporting API
Google Analytics 4

As of 1 July 2023, Google Universal Analytics (UA or GA3) will stop processing data. More and more companies are therefore transitioning to GA4. Unfortunately, historical data from GA3 is not visible in GA4, and if you don't want to lose the data, you must extract everything from UA before 1 July 2024. After that, it will no longer be possible.
Want to know more about GA4? We've gathered all important information and updates here!
There are several ways to do this, such as manually exporting your standard reports, using the Google Analytics Sheets add-on, or working with the Google Reporting API. We believe that the last option is the best. In this article, you will learn how to secure your UA data using the API.
The manual export of standard reports in UA only allows you to select 2 dimensions and export a maximum of 5,000 rows to a CSV or Excel file. This may be insufficient if detailed data about items (such as product title, categories, and SKU) or sessions (source/medium, campaign, content) is needed for a longer period. Google Analytics Sheets offers the possibility to add more dimensions, but the data can be sampled if the time period is too large. Another problem is that you might reach the maximum amount of rows in the spreadsheet based on the granularity of the data that you are trying to retrieve.
The best way to save UA data
The best option to retrieve UA data is the Google Reporting API. The API allows you to easily retrieve all data from longer periods at once. In this article, you will learn how to do this step by step. This way, you can secure the historical data that has been accumulated and save it for future use.
1. Determine which dimensions and metrics are important
Not all data in UA will be essential for your questions. Based on the KPI framework, it can be determined which dimensions and metrics should be included in the queries. A dimension is a descriptive element used to categorise a data point. A metric is a quantitative element used to measure the performance of a data point, such as the number of visitors to a page or the conversion rate of a specific action.
Do you need help determining your KPIs? Our Data Consultants have extensive experience in organising KPI sessions and building KPI frameworks. Contact us for advice or request a KPI inspiration session without obligation.
Examples of dimensions:
- Date: A dimension that is always relevant if you want to be able to see data per day, week, or year or view data for a specific period. Without a date, all data for the selected period will be lumped together.
- Source/medium: Indicates where the traffic comes from.
- Page: Provides information about the important pages.
- Product SKU: Provides information about products. For example: the number of times it has been viewed, added to cart or sold.
Examples of metrics:
- Sessions: The number of times a user has visited the site or app.
- Page views: The number of times a page has been viewed.
- Conversions: The number of times an event that is considered a conversion has been triggered.
It is recommended to create several tables that are the most important for your organisation. For example, a session table, an item table, and a page table. Once you have chosen the appropriate dimensions and metrics, you can initiate the connection between the Google Analytics account and the API.
2. Connection between UA and Google Cloud Console
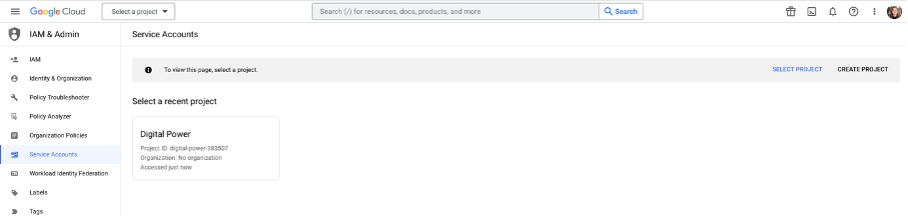
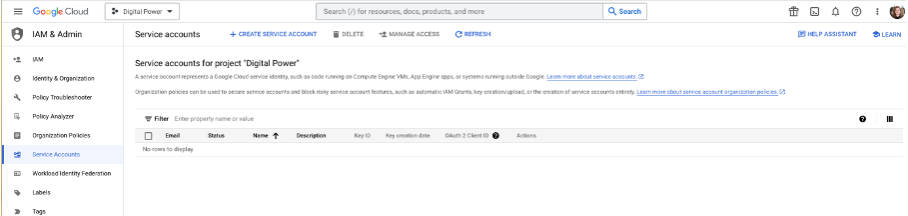
To use the API, you first need to create a project in the Google Cloud Console. Via the Google Service Account you can create a project or select an existing project. After you have selected a project, click on the 'Create Service Account' button at the top.
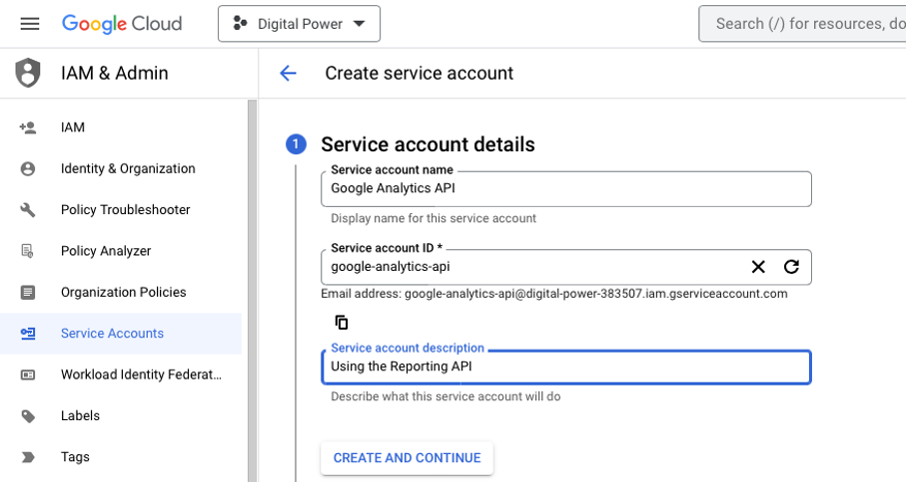
- Give the service account a recognisable name (as in the example below) and specify what the account will be used for.
- Click on 'Create and Continue'. You will now see the created service account, including a new e-mail address.
- Add the e-mail address to the Google Analytics account from which you want to retrieve data with analyst permissions.
3. Create a key
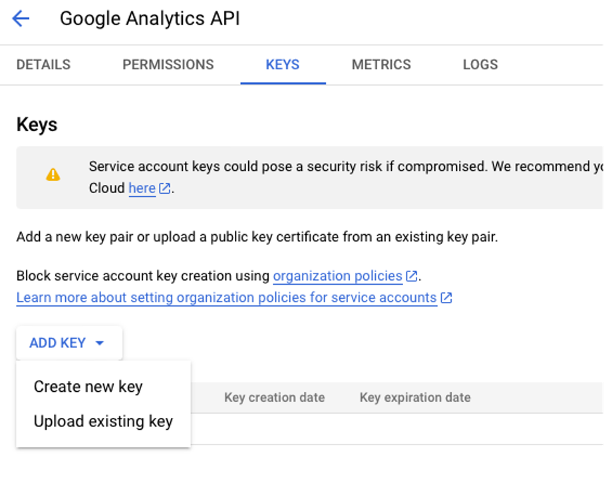
Next, you need to create a key that you can use in the API call.
- Click on the Google Cloud Console e-mail address that you just added in Google Analytics.
- Click on 'KEYS' at the top, then 'ADD KEY' and 'Create new key'.
- Choose a JSON key. This key will now be saved as a file on your computer.
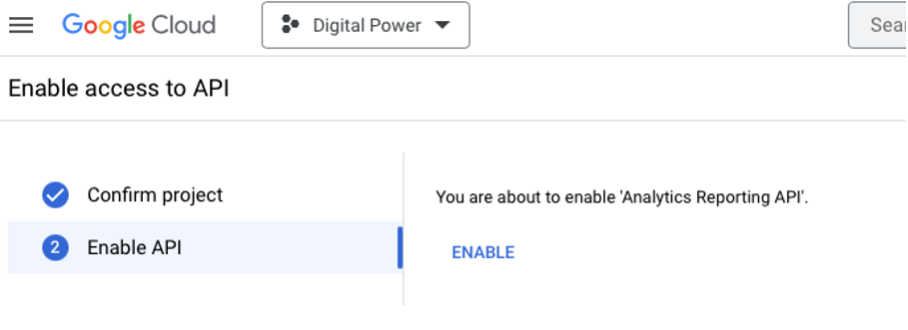
4. Enable access to the API
The last step in the Google Cloud Console is to enable the API. You can enable the API via this link by confirming that you are in the correct project and clicking on 'ENABLE'.
5. Install the appropriate packages and link the key to the call
Now that you have set up the connection between Universal Analytics and Google Cloud Console and created the key, you can set up the API call. This example uses Python, but it can also be done with R, Java, PHP, and JavaScript.
The packages that will help you with this are:
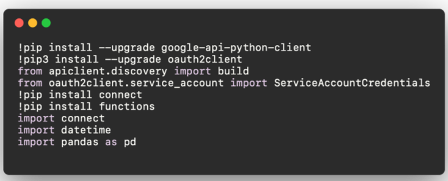
To connect your script to your Google Universal Analytics account, you need to use the JSON file that you downloaded when you created your API key. Place this file in the same folder as the script you are creating. Then use the code below to establish the connection:
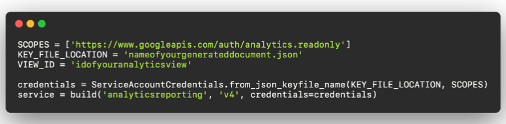
Also, modify the file name and ID of the selected Universal Analytics view.
6. Retrieve the data of a certain time period
To retrieve the desired data from the API, you need to specify the desired metrics and dimensions you determined earlier. With Google's Query Explorer, you can find the correct names for these dimensions and metrics, including the names for custom dimensions. To do this, you need to sign in with a Google account that is linked to the Google Universal Analytics account and select the appropriate property. In the following example, we show how to retrieve data necessary for an item table:
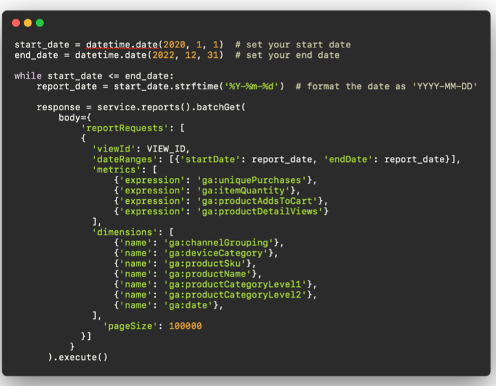
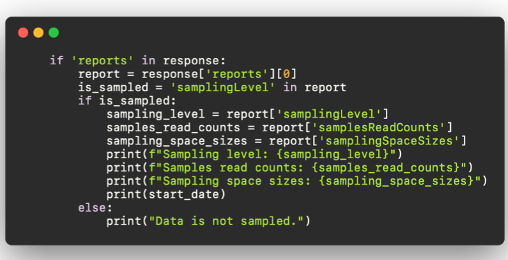
Since sampling can occur in the API response, the data is individually retrieved on a daily basis. By setting a pageSize of 10,000, the maximum pageSize, all data is always retrieved. You can also choose not to retrieve the data in a while loop, but instead choose a smaller start and end date. If you do this, you can check whether the data has been sampled using the following code:
Make sure to store the data correctly. For example, it is recommended to store the data in an empty dataframe and then export it to a CSV file. This way you can retrieve all historical data from Google Analytics. In the above example, you see an item table, but you can work with other dimensions and metrics as well. To use the data in analyses and dashboards, you can save these CSV tables in BigQuery, for example. You can combine the data with other Google Analytics 4 tables.
Need advice or help with securing your data?
Our data specialists are happy to assist you. Can we help you with a seamless transition without losing important web data? Contact us.
This is an article by Michelle Gijsberts, Data Analyst at Digital Power
Michelle is a Data Analyst at Digital Power who focuses on uncovering the question behind the question. Through advanced analysis, she extracts insights from data that are not immediately visible and translates them into actionable recommendations.
Team Lead Data Analyticsmichelle.gijsberts@digital-power.com
Receive data insights, use cases and behind-the-scenes peeks once a month?
Sign up for our email list and stay 'up to data':