Insight into Google Analytics 4 data
How to visualise GA4 data the right way

The end date for using Universal Analytics is getting closer and closer. Many companies have been collecting data in Google Analytics 4 (hereafter; GA4) for some time now. The next step is to visualise GA4 data in the right way. This process raises new questions. "When do I visualise my data in GA4 explore?" and "How do I deal with the quota limits for Looker Studio if I want to make GA4 data insightful?". Our decision tree will help you make the right choices.
Sanne co-wrote this article with Thomas Craenen, Technical Web Analyst at Digital Power.
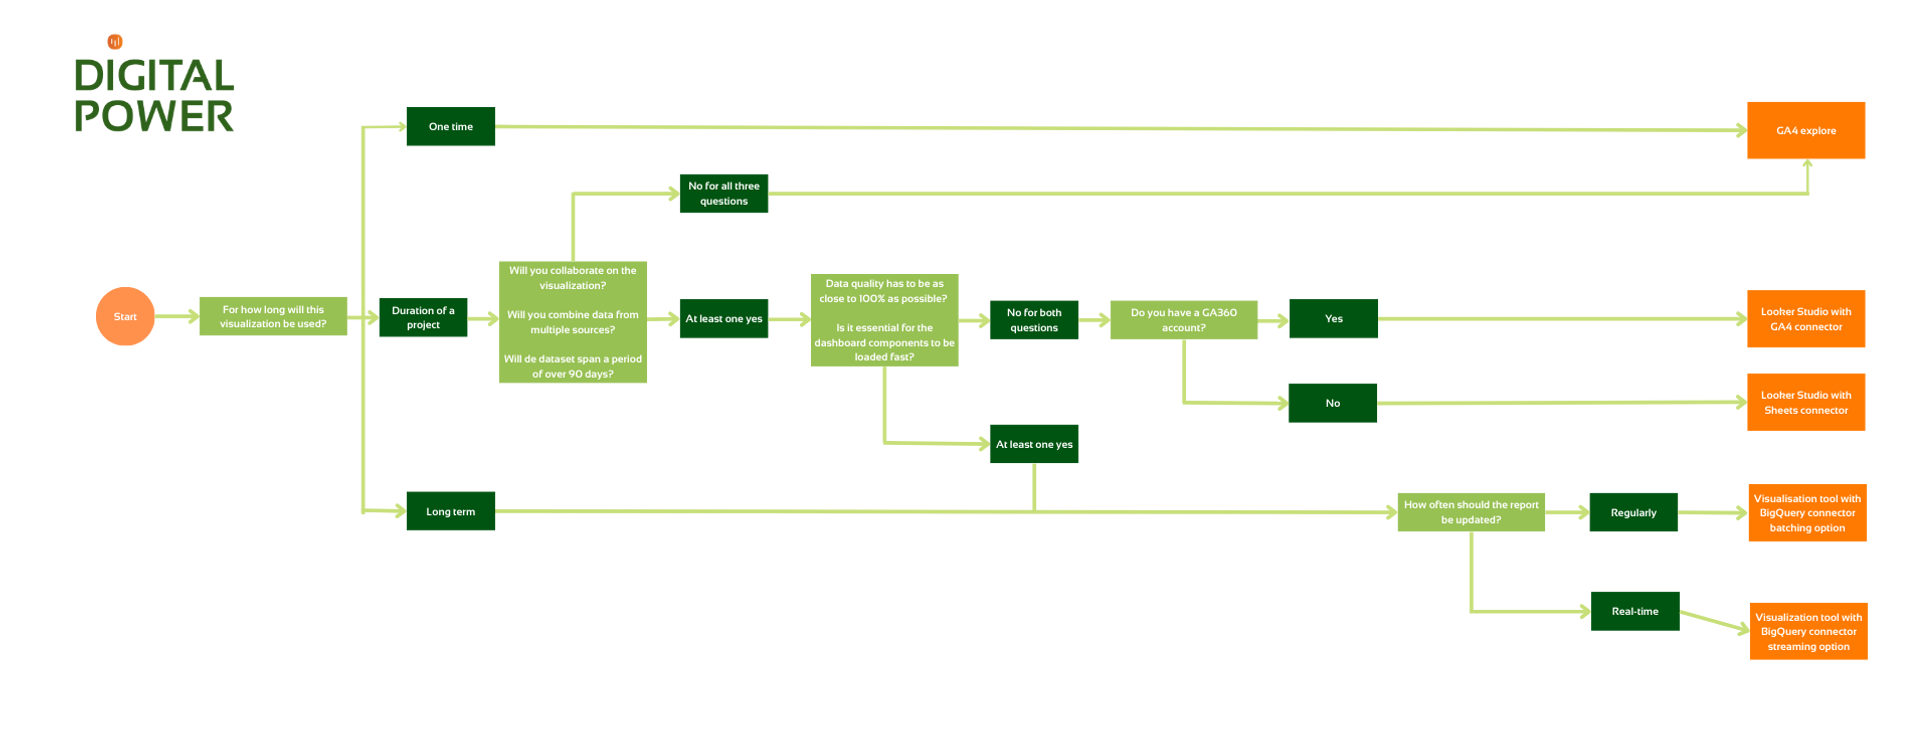
If you want insight into GA4 data, there are several visualisation options to choose. Each option has advantages and disadvantages. To compare these options in the best possible way, we created the GA4 data visualisation decision tree.
We also provide basic and advanced GA4 training. Check all the details here.
The most approachable options are GA4 Explore and Looker Studio. In fact, both options are from Google itself and there are no extra costs. Unfortunately, these visualisation options have several limitations. For example, in Explore it is not possible for a colleague to adjust the data range after an exploration has been shared.
Do you want to report your data with a reliability as close to 100% as possible? And/or do you want to optimise the loading time of your dashboard? Then you will soon end up with another visualisation tool, such as PowerBI. In that case, you use Google BigQuery as a data source.
So there are several options. How you can best visualise your GA4 data depends on a number of things. Ask yourself these important questions if you want to make GA4 data insightful:
How often do I want to get insights from my GA4 data?
- Single-time: for example, you want to see how many users interact with a new, temporary tool on your website.
- Medium-term: you want insight into the performance of an online ad campaign for a job opening, for example. During a campaign, you want to see which optimisations have an effect on the number of applicants. As soon as the job opening is filled, you no longer need the visualisation.
- Long-term: for example, you want to visualise KPIs of the management team. This dashboard is used daily or weekly to make adjustments where necessary.
Do you want to look at certain data once and/or share it with a colleague once? Then you could visualise this data in GA4 Explore. Limitations such as not being able to adjust the data range are then irrelevant. Do take into account the factors that influence data quality, namely data sampling, data thresholds, data cardinality and data freshness.
Do you want to visualise medium-term data (e.g. a project or campaign)? And do you not have to work together in the same dashboard, combine multiple data sources and does the dataset not have to contain data for more than 90 days? Then you can also use GA4 Explore.
So it is not possible for colleagues to collaborate in GA4 Explore. When you share an exploration, your colleague only has view rights. In addition, you can set the data frame to a maximum of 90 days. So if you want to look at a year's worth of data, you won't be able to work with explorations (easily). Nor is it possible to combine multiple data sources.
If you do want to collaborate and/or combine data from various sources and/or need data from a period longer than 90 days, that brings us to the following questions:
What are your data quality requirements? And is it essential that the dashboard loads quickly?
As mentioned earlier, there are several factors that affect GA4 data quality, namely data sampling, data thresholds, data cardinality and data freshness. In this article we will not discuss these factors, for this you can click on the links to consult the Google documentation.
Do you want to report data that is as close to the truth as possible, bypassing the above data quality issues? Then you need to make use of BigQuery. This can be important, for example, if you want to visualise KPI data.
If you find some sampling acceptable and don't need the dashboard to load quickly, you can use Looker Studio. This is a free visualisation tool from Google. This tool is fairly intuitive and easy to work with. In it, you can also combine multiple data sources.
Recently, Looker Studio adjusted the quota limits for GA4 connector, you can read more about it here. If you have a GA360 account, the limits are higher and you can use the standard connector. Don't have a GA360 account? Then place a Google Sheets document between GA4 and Looker. In the Sheets document, add a GA4 extension to retrieve the correct GA4 data. Since Looker retrieves information from Sheets and not directly from GA4, quota limits have no impact.
Disadvantages of using Looker Studio are that you have less control over sampling, the loading time is slower and you may run into (row) limits of Sheets after a while. Keep this in mind when visualising the dashboard and make the sampling issues discussable in your team.
Insight into GA4 data using BigQuery
Do you want long-term insight into certain GA4 data and is data quality important? Then it's best to use data from BigQuery. In BigQuery, you will find the raw GA4 data. BigQuery gives you the freedom to visualise your GA4 data with almost any visualisation tool. If you organise the datasets in the right way (in subsets), this will also have a positive effect on the loading time of your dashboard.
Using BigQuery requires specialist knowledge. This is because, in BigQuery, it is necessary to correctly extract the data from the master table by using SQL. A disadvantage of BigQuery is that it costs money. You pay both for storing tables and for running queries. You can read more about monitoring BigQuery costs in this article.
Don't mind incurring costs and do you have BigQuery knowledge? Then you can use it to visualise your data in the long run with high data quality. Want to know how to keep BigQuery costs down and/or want to know more about how to get the data right from BigQuery? Contact us.
How will you visualise your Google Analytics 4 data?
You can extract insights from GA4 data in different ways. Here, the GA4 explore option is the most approachable. A visualisation tool with BigQuery connection will visualise your data most accurately and have the shortest load time.
Whatever your situation or data issue is, using the GA4 decision tree will help you choose the right option for visualising your data. Our Data Analysts will be happy to help you with it. We can also brainstorm which option is most suitable for your team/company.
Receive data insights, use cases and behind-the-scenes peeks once a month?
Sign up for our email list and stay 'up to data':