Monitoring BigQuery costs
Step-by-step plan: how to create a BigQuery cost overview
- Article
- Data Analytics

If you use BigQuery, whether or not in combination with Google Data Studio, it is useful to keep track of your query costs. You also want to know which queries contribute the most to this. In this article we explain how your BiqQuery costs are generated and how you manage them as efficiently as possible.
If you use BigQuery, whether or not in combination with Google Data Studio, it is useful to keep track of your query costs. You also want to know which queries contribute the most to this. In this article we explain how your BiqQuery costs are generated and how you manage them as efficiently as possible.
What is BigQuery?
BigQuery is a scalable data warehouse from Google. It's a place where as a Data Analyst, you can bring all your data together in an accessible way and at relatively low cost. BigQuery is suitable for large data sets. It provides the ability to analyse aggregated datasets using SQL. That's why it's a popular solution to get insights from multiple data sources.
BigQuery is a paid service where you pay user fees when you run a query directly in the SQL interface (on-demand), but also when you use BigQuery in Google Data Studio. There is a minimum cost (minimum per query approximately: 0.000052 dollar cents) and furthermore it costs 5 dollars per TB processed (1 TB = 1000 GB = 1000. 000 MB).
If you've linked Data Studio to BigQuery, these queries will run while editing a report, during report caching, or in some cases while viewing/filtering a report. By default, Data Studio retrieves the data from BigQuery every 12 hours. So you also pay every time Data Studio processes the underlying BigQuery data.
In a nutshell, running queries in BigQuery costs money and that also applies to queries that are run in Google Data Studio if there is a BigQuery dataset underneath. Because you 'only' pay $5 for each TB of data processed, generally there is no need to worry about this with smaller data sets. Do you work with large data sets? Then the costs can rise considerably and you suddenly wonder where your BigQuery budget has disappeared. For example, your free $300 credit (each new customer to Google Cloud Platform) can also evaporate faster than it should.
How do you monitor BigQuery costs?
There are a number of ways to monitor BigQuery costs. Think of managing the query costs (set limits per project or user), switching to a flat-rate model for query costs (payment model with fixed amounts per period) and/or make it clear where the costs go in BigQuery itself.
A cost overview helps you map out which queries cost (a lot of) money, both in BigQuery and via Google Data Studio, and to what extent users or planned queries contribute to them. This offers opportunities to implement cost savings:
- Make (expensive) planned queries more efficient, so see if the SQL code can be written better in terms of amount of processed data.
- Optimise the link between Google Data Studio and BigQuery. This way you can improve the underlying datasets. This reduces the number of queries required when using the dashboard.
- Discuss consumption with users. Why are they running these queries? Is there perhaps a need for a more structured way of retrieving this data that eliminates the need for the queries?
- Make agreements with users and thus limit unnecessary ad-hoc queries.
Get started!
Does creating a BiqQuery cost statement sound complicated? Not really! We are happy to help you on your way with a step-by-step plan that helps you to set up an overview yourself.
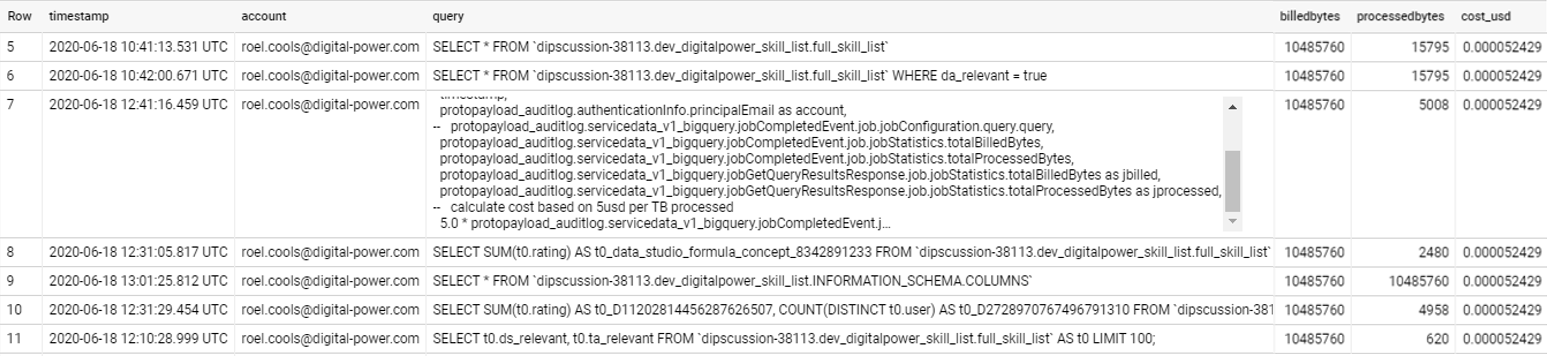
The overview looks like this: timestamp of the query, user, the query itself, the bytes billed, the bytes processed, and the final price in dollars.
Example of cost overview. The costs are tracked for both queries through Data Studio and directly in BQ.
Step-by-step plan for cost overview of BigQuery
Step 1: Go to the Google Cloud Platform, create a new table (create table, source: empty table) in BigQuery and give it a name (e.g.: bigquery_logs)
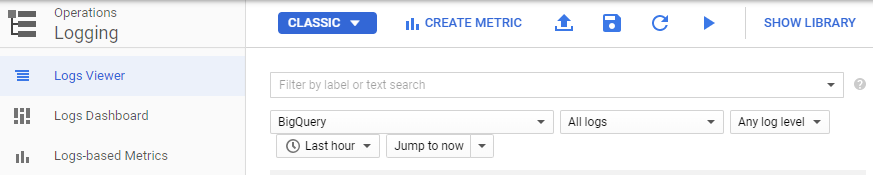
Step 2: In the navigation menu of the Google Cloud Platform choose "Logging" (under the heading Operations).
Step 3: In the "Logs Viewer" select BigQuery as resource as below:
Step 4: Click on "Create Sink" and give the Sink a name (eg bigquery_sink_logs). Choose as Sink service: BigQuery and as destination the table name you created in step 1. Optionally you can check the partition table option.
Step 5: In the "Logs Router" you can now find the created Sink. Copy the value from the "Writer Identity" field: (serviceAccount:"value")
Step 6: Go back to the table created in BigQuery from step 1 and click on "Share Dataset". Enter the just copied value at "Add members" and select "editor" as role. Finally click on "Add".
Step 7: There should now be 2 tables below the table created in step 1:
"cloudaudit_googleapis_com_data_access" and "cloudaudit_googleapis_com_data_activity"
Step 8: In the _data_access table you can run the following query to get an overview of the costs per user and per query:
SELECT
timestamp,
protopayload_auditlog.authenticationInfo.principalEmail as account,
protopayload_auditlog.servicedata_v1_bigquery.jobCompletedEvent.job.jobConfiguration.query.query as query,
protopayload_auditlog.servicedata_v1_bigquery.jobCompletedEvent.job.jobStatistics.totalBilledBytes as billedbytes,
protopayload_auditlog.servicedata_v1_bigquery.jobCompletedEvent.job.jobStatistics.totalProcessedBytes as processedbytes,
— calculate cost based on 5usd per TB processed
CAST(5.0 * protopayload_auditlog.servicedata_v1_bigquery.jobCompletedEvent.job.jobStatistics.totalBilledBytes / 1000000000000 as numeric) as cost_usd,
FROM
`YOUR_OWN_DATASET`
WHERE
protopayload_auditlog.servicedata_v1_bigquery.jobCompletedEvent.job.jobStatistics.totalBilledBytes IS NOT NULL
Need help or tips?
Can't figure it out or would you like the help of a specialist? Our Data Analytics Consultants are happy to share their thoughts with you! Contact us.
This is an article by Roel Cools, Data Analytics Consultant at Digital Power
Roel is a Data Analyst with a focus on mobile applications. He mainly focuses on collecting, making usable and analysing customer data in order to improve the user experience in the broadest sense of the word.
Data Analystroel.cools@digital-power.com
Receive data insights, use cases and behind-the-scenes peeks once a month?
Sign up for our email list and stay 'up to data':