Clear dashboards for the IC team during the Corona crisis

UMC Utrecht

  • Customer case
  • Data Engineering
  • Data Analytics
  • Data projects
medical gloves
UMC Utrecht logo
René de Boer Digital Power
René de Boer
CEO
3 min
28 Apr 2020

In times of the coronavirus (COVID-19), a good overview of the patients in the scaled-up intensive care of the Utrecht medical centre is vital. Employees must be able to view patient characteristics, the most current lab readings and the course of patients' vital signs at a glance. In addition, up-to-date insight into the bed occupancy per department and the capacity of the nursing staff is required. We immediately got started to provide the necessary insights for UMC Utrecht. As a way of also contributing in these times of crisis, we offered our hours free of charge.

Our approach

UMC Utrecht set up a team consisting of a Data Manager, a BI specialist and several consultants. Our Data Engineers started by making the data available directly from the live sources.

UMC Utrecht's usual reporting tool makes it difficult to combine real-time information from different sources into one overview. That's why our Data Analysts used the Power BI data visualisation tool to integrate information from different sources and make real-time dashboards available.

The dashboards had to match the existing reports as much as possible. This allows the Crisis Team and IC staff to interpret the information quickly and intuitively.

UMC Utrecht was closely involved in every step of the development of the dashboards. This was essential to visualise the necessary insights in one week.

The result

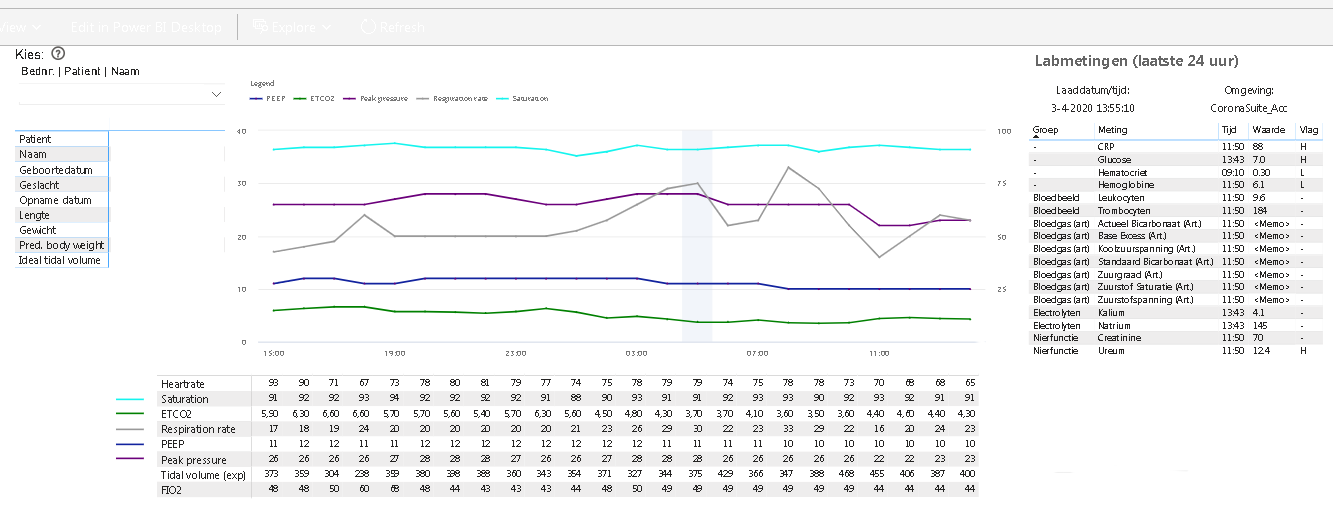
The first dashboard that we produced provides an up-to-date overview of patients' health progress in the temporary IC at any time of the day.

Information from various sources has been combined in one clear overview. This makes it easy to see an overall picture for each patient:

An anonymised example of a dashboard with information about a patient in the ICU

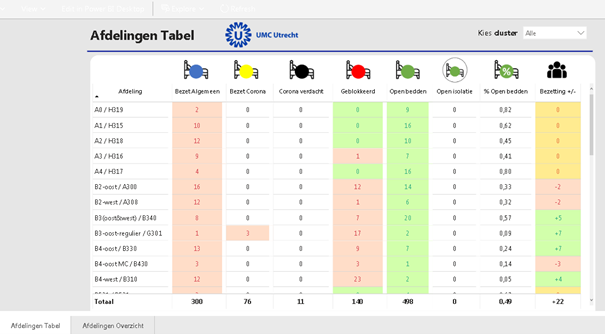
The second dashboard provides insight into the current bed occupancy and the capacity of the nursing staff. The number of COVID-19 patients can be monitored by dividing the bed occupancy into

A part of the dashboard with the bed occupancy per department and the available capacity

Both dashboards have been exceptionally well received and are being used to help the intensive care team make the right decisions.

Want to know more?

René will be happy to talk to you about what we can do for you and your organisation as a data partner.

Receive data insights, use cases and behind-the-scenes peeks once a month?


Sign up for our email list and stay 'up to data':

You might find this interesting too:

The corona dashboard of the RIVM

Our team follows the news about the corona dashboard of the Dutch National Institute for Public Health and the Environment (RIVM) with great interest. Creating such a dashboard is quite easy if the data is available. But how do you analyse and interpret it? Our Data Analysts will explain it to you.

Read more

Increased ROI in healthcare campaign thanks to improved insight

Various departments within Univé made decisions based on data from multiple data sources and separate reports. As a result, each department made decisions based on different information. The departments were also not always aware of each other's performance. We investigated how the integration of the data sources using the Microsoft Power BI visualisation tool could improve decision-making.

Read more
COVID violence tracker

The COVID-19 Violence Tracker

The outbreak of the corona pandemic in early 2020 has turned the world upside down. In addition to countless infections, hospitalisations and deaths, we also saw an outbreak of violence in many countries. Citizens took to the streets, sometimes violently, to protest against the measures taken, but domestic violence also increased in many places and fear and frustration played a role in racism.

Read more
Data Engineer at work

Your Data Engineering partner

Generate reliable and meaningful insights from a solid, secure and scalable infrastructure. Our team of 25+ Data Engineers is ready to implement, maintain and optimise your data products and infrastructure end-to-end.

Read more

5 reasons to use Infrastructure as Code (IaC)

Infrastructure as Code has proven itself as a reliable technique for setting up platforms in the cloud. However, it does require an additional investment of time from the developers involved. In which cases does the extra effort pay off? Find out in this article.

Read more
fysioholland data

A well-organised data infrastructure

FysioHolland is an umbrella organisation for physiotherapists in the Netherlands. A central service team relieves therapists of additional work, so that they can mainly focus on providing the best care. In addition to organic growth, FysioHolland is connecting new practices to the organisation. Each of these has its own systems, work processes and treatment codes. This has made FysioHolland's data management large and complex.

Read more
Data Engineer at work

Data Engineer

Work on challenging technical assignments with various clients.

Read more
implementing a data platform

Implementing a data platform

Based on our know-how, the purpose of this blog is to transmit our knowledge and experience to the community by describing guidelines for implementing a data platform in an organisation. We understand that the specific needs of every organisation are different, that they will have an impact on the technologies used and that a single architecture satisfying all of them makes no sense. So, in this blog we will keep it as general as we can.

Read more

Why do I need Data Engineers when I have Data Scientists?

It is now clear to most companies: data-driven decisions by Data Science add concrete value to business operations. Whether your goal is to build better marketing campaigns, perform preventive maintenance on your machines or fight fraud more effectively, there are applications for Data Science in every industry.

Read more

5 questions for Data Engineer Dennis

In this video, you will find out what a job as a Data Engineer looks like! What does a working week look like, which clients do our Data Engineers work for and what makes working so much fun? Dennis likes to tell you more about it!

Read more