Enhanced customer journey through process mining
City of The Hague
- Customer case
- Data consultancy
- Customer Experience
- Research


The City of The Hague was seeking a partner to assist them with their web analysis. In doing so, they had a central goal: to investigate the performance of their future new website and identify opportunities for further optimisation. They enlisted our help to establish and execute the process.
Approach
To map out the optimisation opportunities for the new website, we recommended conducting a baseline measurement after the website's launch. One of the processes we set up for this purpose looked as follows:
1. We identified the top 10 most important and substantial online customer journeys for the City of The Hague.
2. For these customer journeys, we diagrammed all online touch points in a user flowchart. In this, we outlined the ideal journey with a visualization of the necessary and optional steps to complete a process. We indicated which Key Performance Indicators (KPIs) we would use to measure success and the type of page involved (e.g., a navigation page or a form). We also visualized the option to get in touch and the potential entry and exit points.
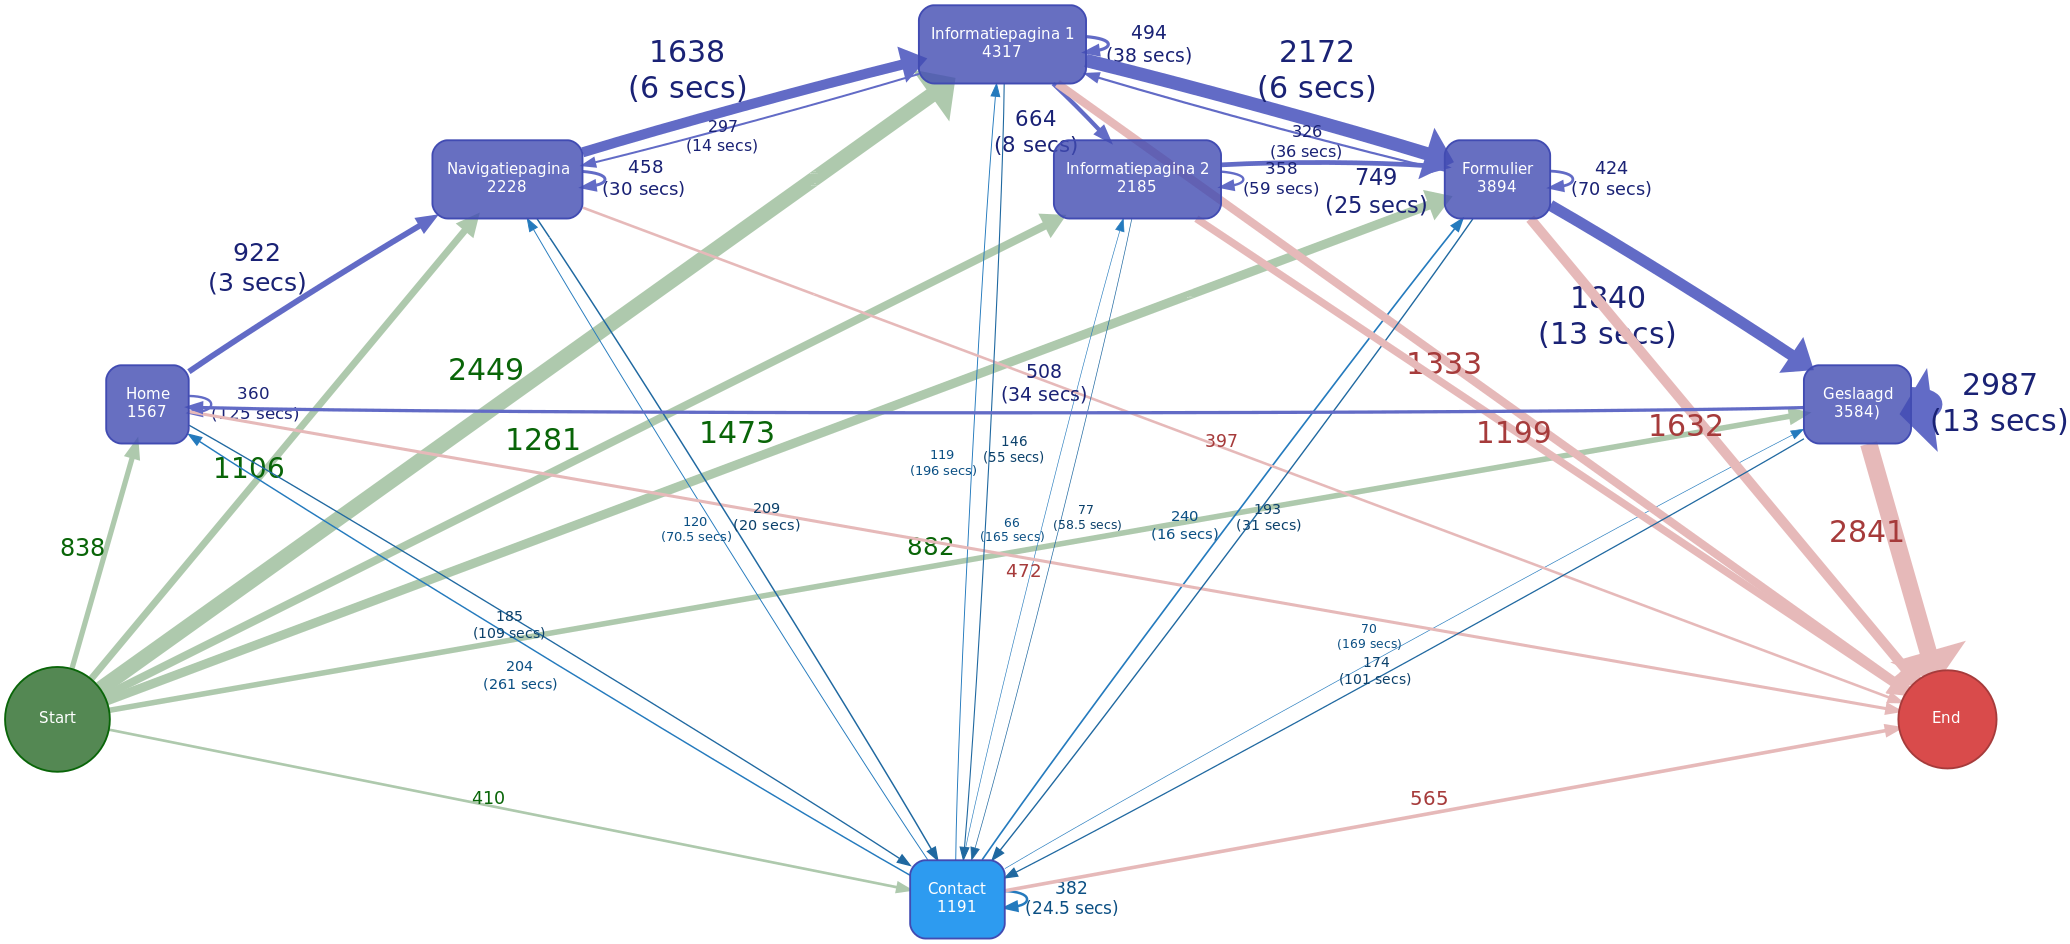
3. We advised exploring whether the ideal customer journey aligns with reality. We recommended applying process mining once the new website is live. This involves mapping out the actual process based on web data. You then see how users navigate through the website. The City asked us to implement this advice for them as well.
We implemented the process mining method in these 5 steps:
1. We extracted the raw web data using an API into a central data research environment (DRO).
2. We prepared the raw data for analysis in DRO using the toolR.
3. Using the 'bupaR' package in R, we set up the process. With this, we made processes on the website visible using visualisations. We did this specifically for users who interacted with the journeys we had prioritised in the research phase.
4. For a clear overview, we selected which specific data to display and how to visualise them. For instance, if certain behaviours were exhibited by only a small number of users, we might not visualise this data.
5. We used colours, adjustments in sequence, and interaction placement to create clear visual distinctions between different paths.


Result
The ideal customer journeys for the top 10 topics have been outlined. Additionally, the approach for implementing process mining has been determined and all preparations have been made. This allows us to dive straight into process mining when the new website is launched.
Future
Once the website is live, we will compare the ideal customer journey with the actual customer journey. We'll do this using process mining, aiming to identify improvement points and optimisation opportunities.
Subsequently, we intend to validate these through A/B testing (quantitative data) and user research (qualitative data) in a new collaboration with the City's UX researchers. Insights from qualitative and quantitative research will be combined to yield better insights and solutions.
Want to know more?
Jonathan will be happy to talk to you about what we can do for you and your organisation as a data partner.
Account Manager+31(0) 20 308 4390+31(0) 6 4150 4041jonathan.oversteegen@digital-power.com
Receive data insights, use cases and behind-the-scenes peeks once a month?
Sign up for our email list and stay 'up to data':


