Optimisation of marketing activities through an integrated dashboard
Valk Digital
- Customer case
- Data consultancy
- Data Analytics
- Dashboarding


Valk Digital, an internet company, aimed to adopt a more data-driven approach. The marketing team was already discussing all the data weekly using an Excel spreadsheet, but due to manual data input, it was time-consuming and more likely to fail. There was a need for an automated, future-proof approach based on reliable data.
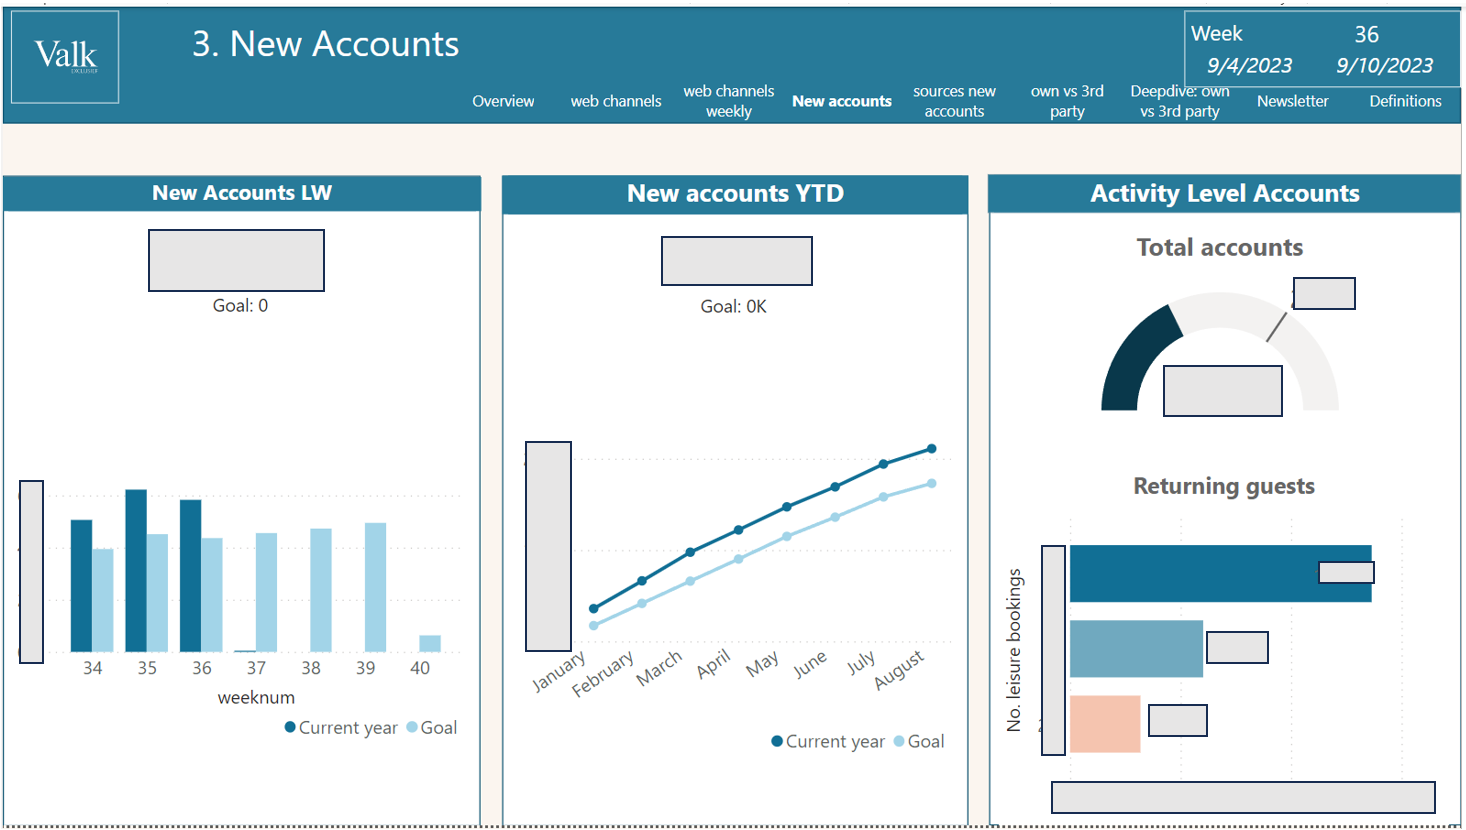
For data collection, our Data Engineers started on building a data warehouse. We also visualised the data in a marketing dashboard. This allows the marketing team to monitor its objectives weekly and take prompt action on new insights. They asked us to advise them on how to further enhance these actions.
Approach
First, we documented the requirements of the marketing team and the organisation. We held discussions with the marketers and reviewed their marketing KPIs. From these discussions, three significant requests emerged:
- Trend analysis: Identifying current trends in search queries and webpages. Were there seasonal differences between, for example, summer and autumn-related search queries?
- Weekly performance: An evaluation of the performance of marketing activities in the past week. This analysis provided insights into successes and areas for improvement in the campaigns.
- KPI monitoring: An overview of the status of key marketing KPIs for better insight into overall results.
Once the requirements were clear, we began transforming the Excel spreadsheet into a PowerBI dashboard. We linked the dashboard to the data warehouse we had set up earlier, ensuring data reliability and automatic updates. We used PowerBI to visualise the data for the marketing team, making it easier for them to identify improvement opportunities and trends.
After building the PowerBI dashboard, we joined the weekly marketing meeting. We analysed the incoming data and provided advice on how the marketers could adjust their marketing activities.
Thanks to the marketing dashboard and the insights gained, the team's goals and priorities became clearer. Based on these insights, we continued to optimise the dashboard. Additionally, during the weekly meetings, the marketers could share their questions with us, and we would address them. When investigating these issues, we always aimed to uncover the underlying questions, making it clear to them why we were exploring specific topics.
Results
The automated marketing dashboard has delivered measurable benefits for Valk Digital. With reliable data feeds from the data warehouse and clear visualisations in PowerBI, marketers have insights into trends, weekly performance, and KPI progress.
Our advisory role during the weekly meetings not only enhanced decision-making but also helped to understand the "why" behind the data. Because we continue to engage with the marketing team weekly, a dynamic improvement process is in place. Marketing activities are becoming increasingly data-driven.
Future
Now that the foundation is in place, we can further expand the dashboard with custom analyses for each marketing specialisation. This includes automated dashboards for channels such as social media, the webshop, SEO, and SEA. This will enable more in-depth analyses and maintain a future-proof approach.
Want to know more?
Stefan will be happy to talk to you about what we can do for you and your organisation as a data partner.
Commercial Manager Technical Web Analytics+31(0)20 308 43 90+31(0)6 33 65 99 17stefan.put@digital-power.com
Receive data insights, use cases and behind-the-scenes peeks once a month?
Sign up for our email list and stay 'up to data':