Digital transformation for cross-channel customer experience using data.
Van Gogh Museum
- Customer case
- Data Analytics


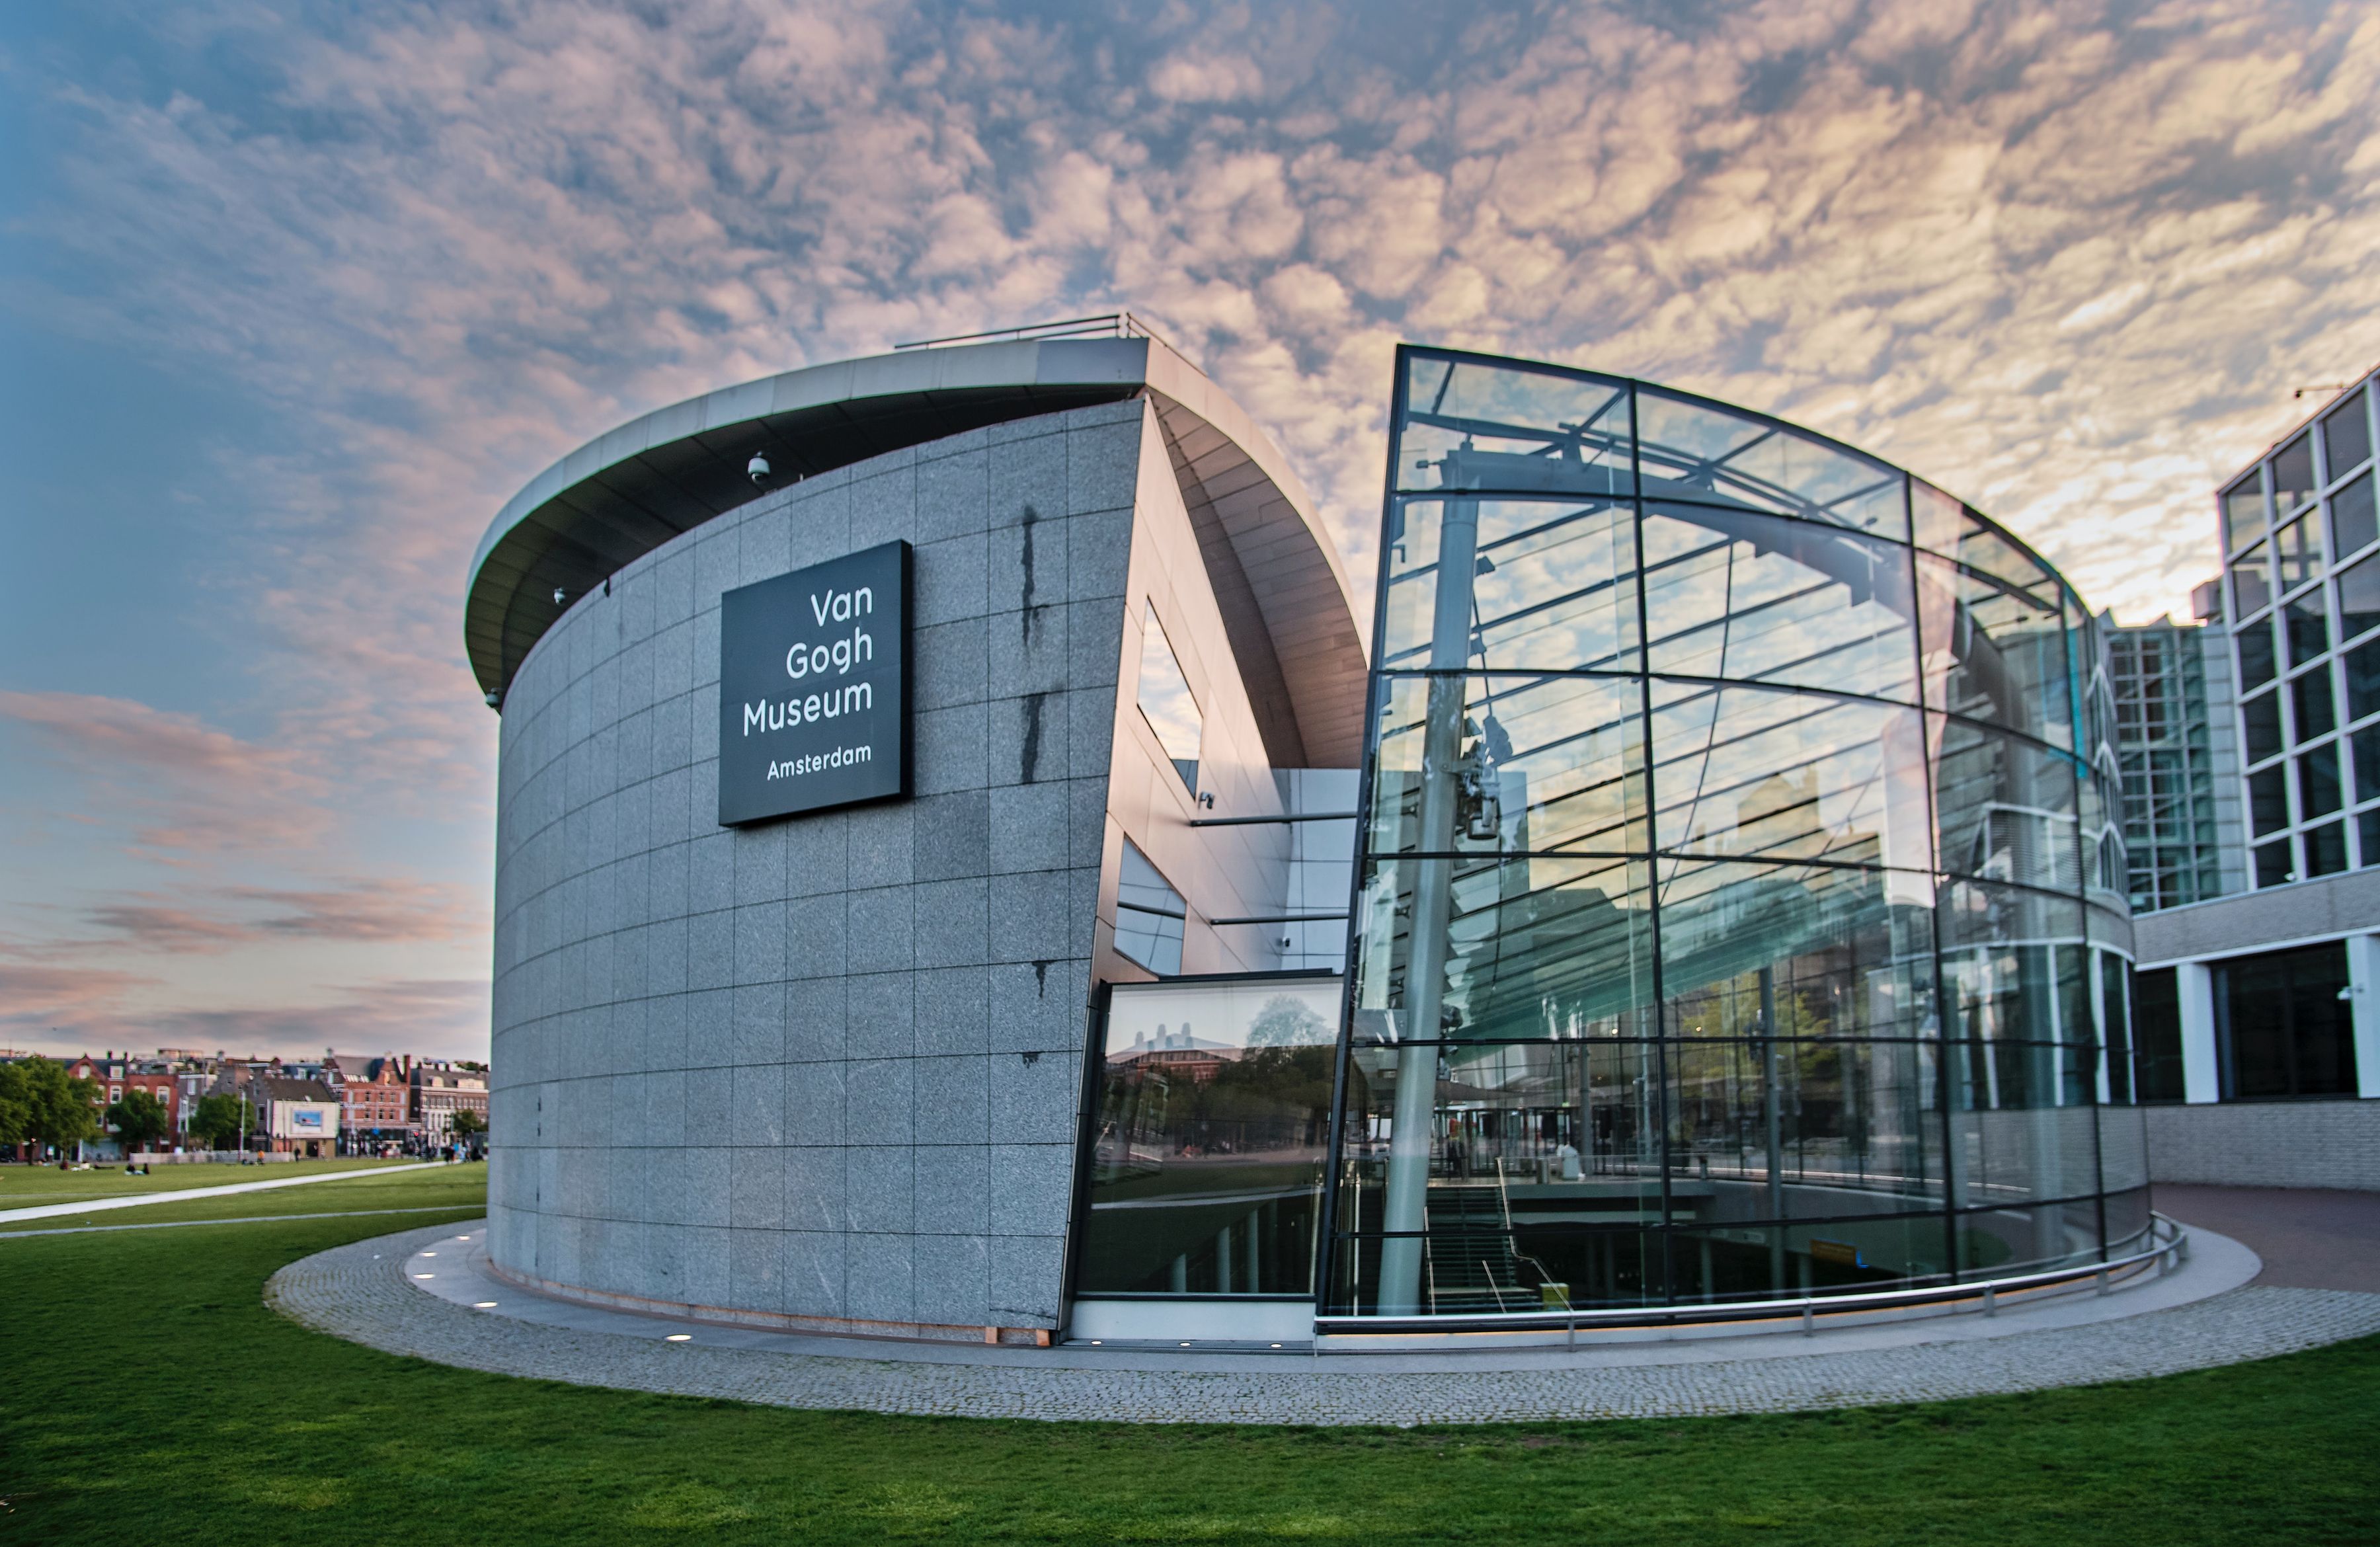
The Van Gogh Museum is the most visited museum in the Netherlands. More than 2.2 million people visited the museum in 2017. Data is collected from all those people. Data from the website and other online marketing channels, but also offline data from ticket sales at the box office, for example.
All this data is collected and used by separate departments within the company. However, there was no central data storage. There was a need for this in order to improve internal cooperation and to be able to establish links between the internal activities. Rather than by department, the Van Gogh Museum wanted to be able to fully measure the customer journey. For this, they enlisted the help of our data specialists.
Our approach
After identifying the objectives with the stakeholders for each department, we started building a KPI framework. This comprehensive document translates the business objectives into measurable Key Performance Indicators. The KPI framework includes information about the data sources, required tagging and data collection methods.
We then created a local database in which all data comes together. We visualised the data with Tableau. This is how we built the first global dashboards that answered questions such as:
- What do we gain from data?
- Where can we focus on?
- What data-driven actions can we take?
By means of interim feedback rounds with the stakeholders, we were able to further fine-tune these dashboards.
The result
The dashboards provide insight into the results of social media activities, Search Engine Marketing and the performance of the website. This information is integrated with information from offline data. For example, we built a booking dashboard that provides insight into the pre-purchased tickets via all offline and online sales channels. This will allow better distribution of the marketing budget.
The dashboards are shared internally on a monthly basis. Employees from different departments within the Van Gogh Museum are now looking at the same data. Among other things, they use the information to get answers to specific business-related issues such as:
- How are ticket sales going?
- What was the occupancy rate last month?
- How many 'no shows' were counted (people who bought a ticket online but did not visit the museum)?
- Through which channel did museum visitors buy a ticket?
- How do crowds in the museum affect the customer experience?
Want to know more?
Our CEO René would be happy to talk to you about what we can do for you and your organisation.
Receive data insights, use cases and behind-the-scenes peeks once a month?
Sign up for our email list and stay 'up to data':


