Making impact measurable
Designathon Works
- Customer case
- Data Analytics
- Data Engineering
- Data projects
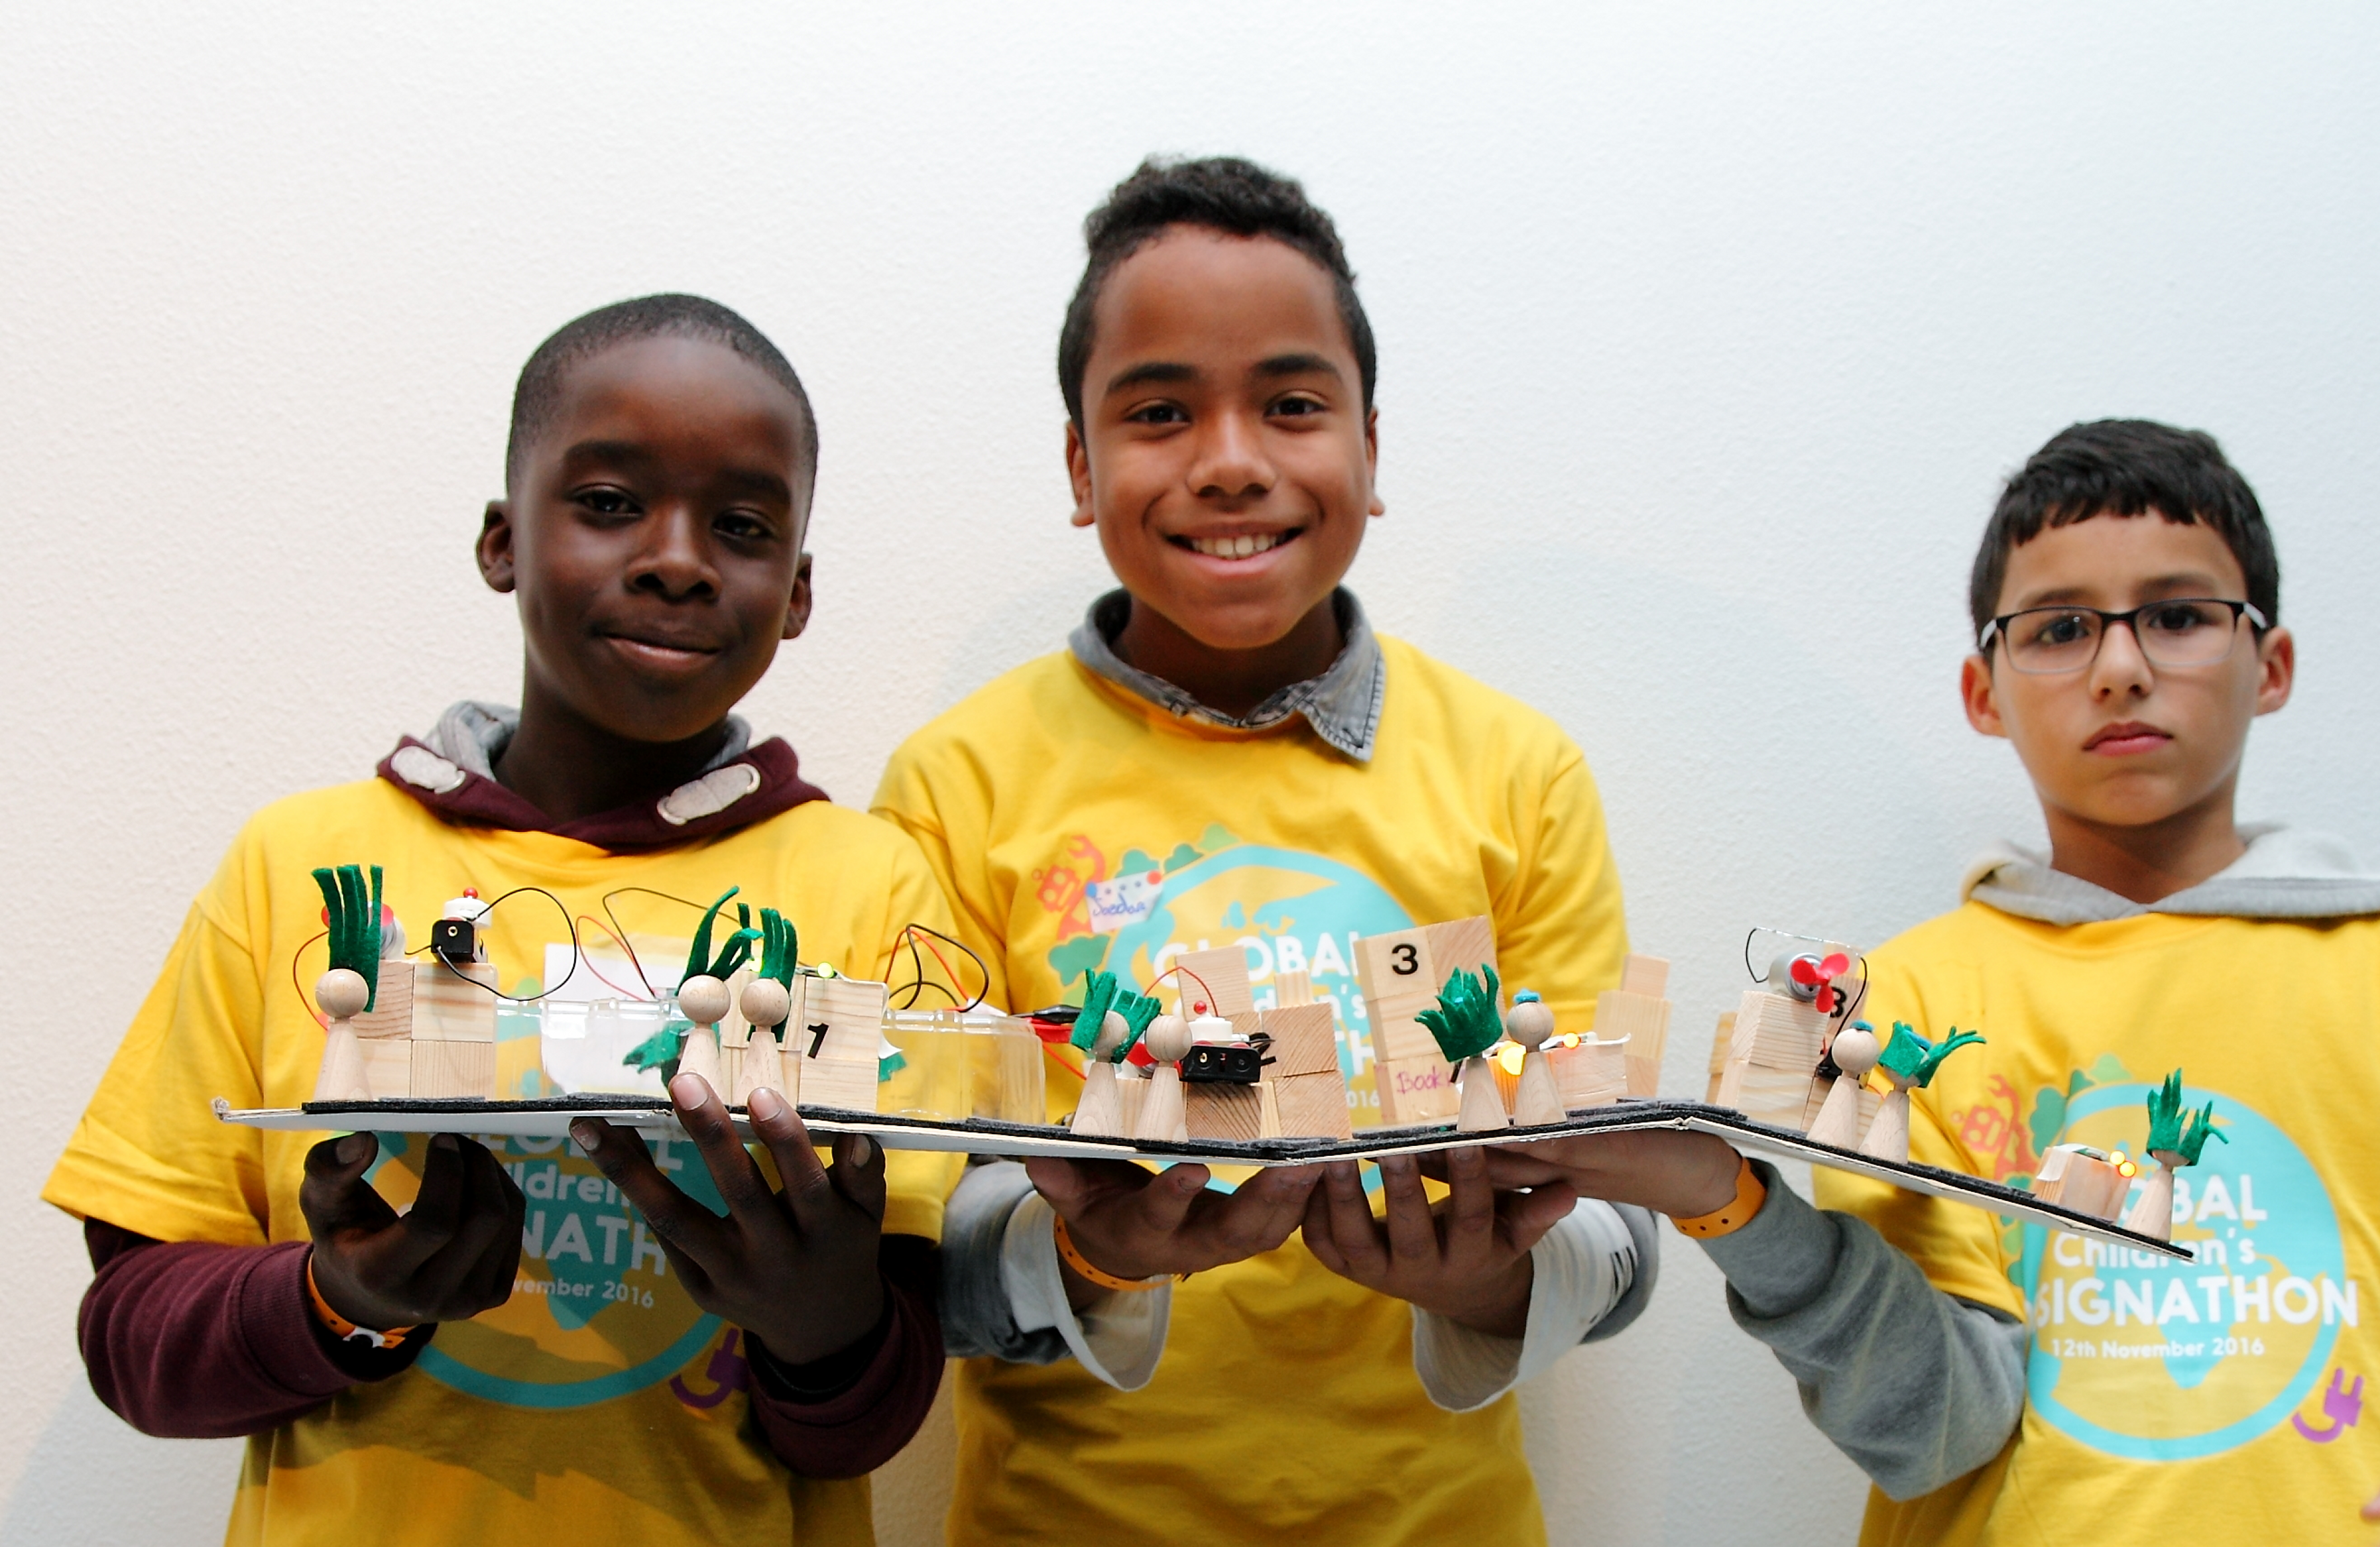


The Designathon Works foundation organises Design Hackathons (Designathons) for children aged 8 to 12. The target? Teaching children from all over the world skills to become a 'changemaker'. They are challenged to design solutions for a better world, for example to combat climate change. From the Datahub, we helped Designathon Works fine-tune the impact measurements free of charge. We also made a first move towards automating data collection, analysis and visualisation.
Our approach
Our approach consisted of several steps, 1) deciding on what should be measured, 2) how we are going to measure this, and 3) how we can automate the process of data collection, analysis and visualisation as much as possible.
To determine what needs to be measured, we refined Designathon Works' Theory of Change and M&E (Monitoring & Evaluation) Framework. We organised this through a brainstorming session. NGOs generally determine with the help of a Theory of Change and an M&E framework what impact they have in mind and how they want to make this measurable. It is similar to a KPI framework of a commercial organisation.

For this project, we mainly focused on the learning goals of the participating children. During the Designathon, do the children acquire the skills, knowledge and attitudes to become 'changemakers'?
Making these learning objectives measurable poses some challenges. For example, the questions must be well adapted to the level of the children (8-11 years). In addition, we cannot ask them too many questions in a row because children can concentrate less on answering questions than adults. Finally, a designathon is all about the creative process. For many children, a questionnaire naturally resembles a test. This is not conducive to the creative thinking process and comes at the expense of data quality.
Another challenge is that not all children participating in the Designathons have a digital device (such as a computer or smartphone) to answer questions. However, Designathon Works prefers to store the data uniformly, centrally and automatically.
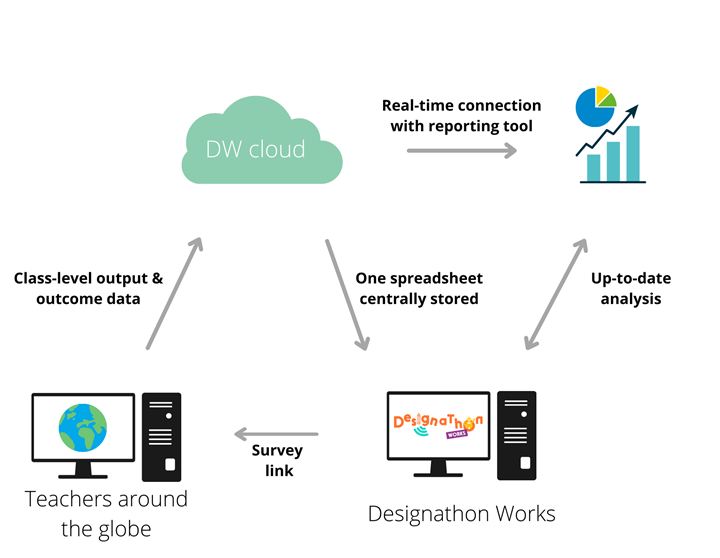
We proposed setting up a uniform 'offline' data collection that is only digitised later on. Some of the questions are made part of the teaching materials in a playful way, namely on the sketch sheets that the children use to draw their designs. The teacher can easily upload photos of these sketches to a central storage. Other questions are asked interactively in class, with the teacher tracking the children's answers and filling them into a standardised online form after class.
When the teachers provide the data in the same way with this form, the data is centrally stored, automatically analysed and visualised.
The result
Together with Designathon Works, we determined what will be measured, how we will measure this, how we can store data centrally and analyse it automatically. After implementation, data can be automatically analysed and visualised in a dashboard. This is how Designathon Works always has real-time insight into the output and outcomes of its activities.
We opted for a simple and scalable solution, allowing Designathon Works to continue to collect data in a uniform way in the future. This allows them to compare different countries and schools, even over the years. In addition, they can continue to make adjustments where necessary based on these insights.
We carried out this project through our foundation, the Digital Power Datahub.
Want to know more?
Marieke, chair of the Digital Power Datahub will be happy to talk to you about what we can do for you and your organisation as a data partner.
Chair Digital Power Datahub+31(0)6 10 93 54 60marieke.schulte@digital-power.com
Receive data insights, use cases and behind-the-scenes peeks once a month?
Sign up for our email list and stay 'up to data':
