The COVID-19 Violence Tracker
PeaceTech Lab
- Customer case
- Data Analytics
- AI & Data Science
- Data projects


The outbreak of the corona pandemic in early 2020 has turned the world upside down. In addition to countless infections, hospitalisations and deaths, we also saw an outbreak of violence in many countries. Citizens took to the streets, sometimes violently, to protest against the measures taken, but domestic violence also increased in many places and fear and frustration played a role in racism.
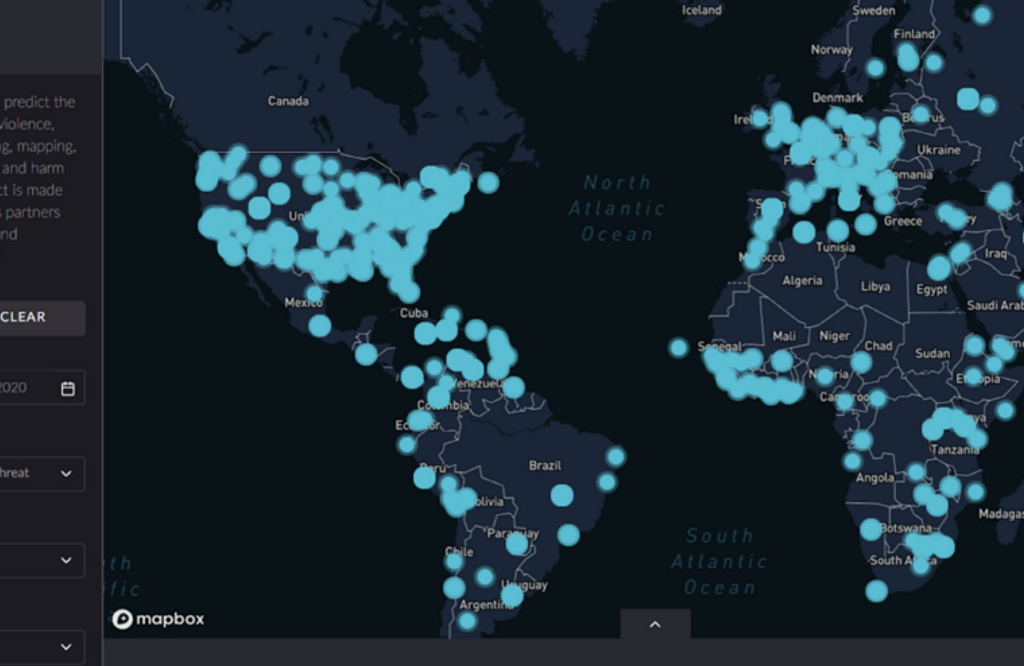
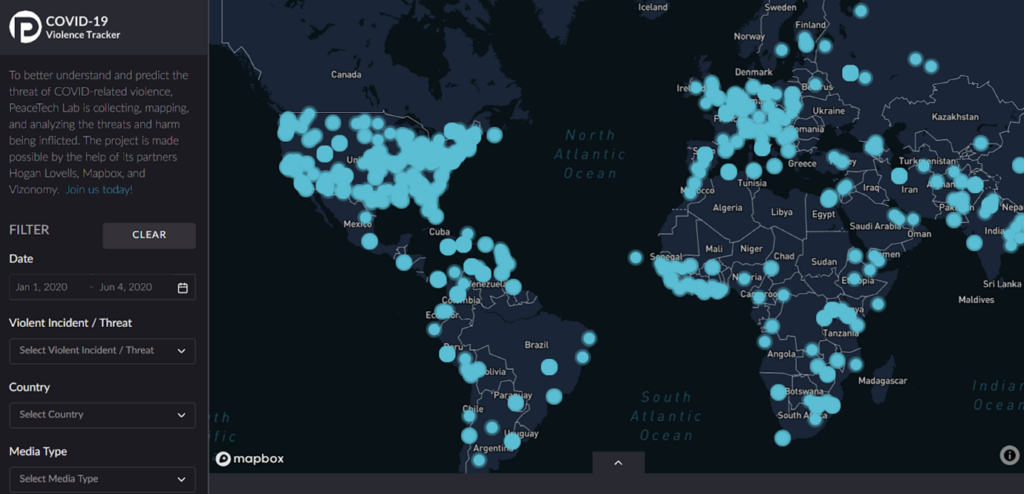
In May 2020, PeaceTech Lab (US) reported to PeaceTech Lab NL and Digital Power with a prototype of the COVID-19 ViolenceTracker. Assisted by volunteers, PeaceTech Lab had manually collected reports on corona-related violence and visualised the insights in a dashboard (see figure 1). The lab then wanted to automate the collection of news items. This turned out to be an excellent challenge for our consultants!
Our approach
Starting from May 2020, various Data Scientists, Data Engineers and Data Analysts from our team have contributed to building the tracker. We donated over 200 hours of work through our foundation, the Digital Power Datahub. We largely took charge of the technical implementation and discussed progress with the PeaceTech Lab teams on a weekly basis. The project ultimately consisted of eight phases:
Phase 1
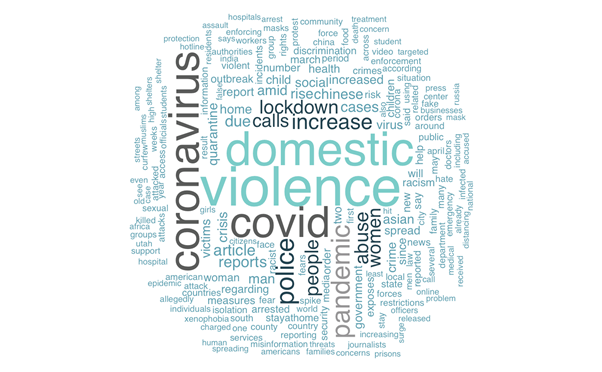
We started with a (text) analysis of the vocabulary in the manually collected news items. The word cloud below is a visualisation of that. We looked at what the most common words were in the news stories and often came across "domestic", "violence" and "police" for example.
Phase 2
After research, we chose an appropriate method for data collection, which ended up being social listening with the Brandwatch tool. This allowed us to collect automated news items from the web that contained certain words (such as "domestic" and "violence").
Phase 3
We wrote a (search) query with the most relevant (combinations of) English words, for example "covid"+"violence".
Phase 4
From July 2020, we continuously collected news items via Brandwatch. In total we collected more than 9 million messages.
Phase 5
Although Brandwatch is a useful tool for data collection, it did not offer all the possibilities we were looking for in the analysis of our data. That is why we developed a separate data infrastructure in Google Cloud. The data from Brandwatch was automatically exported there, allowing us to work with the data ourselves.
Phase 6
As soon as we started the first analyses of the data, we found that there was a lot of noise (irrelevant news items) in our dataset. We wanted to get rid of this. That is why we held three validation rounds with volunteers who indicated which messages truly were about corona-related violence. By doing this, we started a major data cleanup.
Phase 7
Based on insights from these validation rounds, we optimised our query in Brandwatch. We removed words with double meanings, such as "beat" (meaning hitting, but also beating in sports) from the search. These were largely responsible for the noise.
Phase 8
Even with these adjustments, there was still a lot of noise in our data set. So it was time to bring out the big guns: we developed an NLP model with our validated datasets that learned to distinguish between relevant and irrelevant news items. Ultimately, we concluded the project with a properly cleaned dataset.
The result
In September 2021, 16 Digital Power data specialists were given 3 hours to extract insights from the dataset that could be of interest to policymakers.
While this hackathon once again exposed data quality issues, our consultants also discovered some interesting opportunities. One of the teams, for example, worked on a text analysis to map the language use around various themes (such as racism).
A second team looked at geographic patterns in reporting on corona-related violence, and looked at possible links between (the volume of) reporting and press freedom in different countries. In short: although the data quality of the dataset is still not perfect, there is plenty to investigate with the COVID-19 Violence Tracker!
Curious about the dataset? Download it here.
Partners
We carried out this project via our Datahub foundation, together with PeaceTech Lab. In addition, the following partners contributed:
Want to know more?
Sanne, chair of the 'data for good' pillar of the Digital Power Datahub, is keen to discuss how we, as a data partner, can support you and your organisation.
Account Manager Datahub datahub@digital-power.com
Receive data insights, use cases and behind-the-scenes peeks once a month?
Sign up for our email list and stay 'up to data':