Improved data quality thanks to a new data pipeline
Aa en Maas Water Authority
- Customer case
- Data Engineering
- Data consultancy
- Data projects


At Royal HaskoningDHV, the number of requests from customers with Data Engineering issues continue to climb. The new department they have set up for this, is growing. So they asked us to temporarily offer their Data Engineering team more capacity. One of the issues we offered help with involved the Aa en Maas Water Authority.
The hydrologists of the Aa en Maas Water Authority use many different databases for their work. One of those databases contains data from sensor measurements, for example of the water level at various places in the region. It was not certain whether these data were always correct. They asked Royal HaskoningDHV to make a validation and to get the data quality in order. In this way the sensor measurements can be improved and the Water Authority can repair faulty sensors.
Our approach
Aa en Maas Water Authority already had access to a data platform in Azure. On behalf of Royal HaskoningDHV, we developed an additional data pipeline that can be integrated with the existing platform.
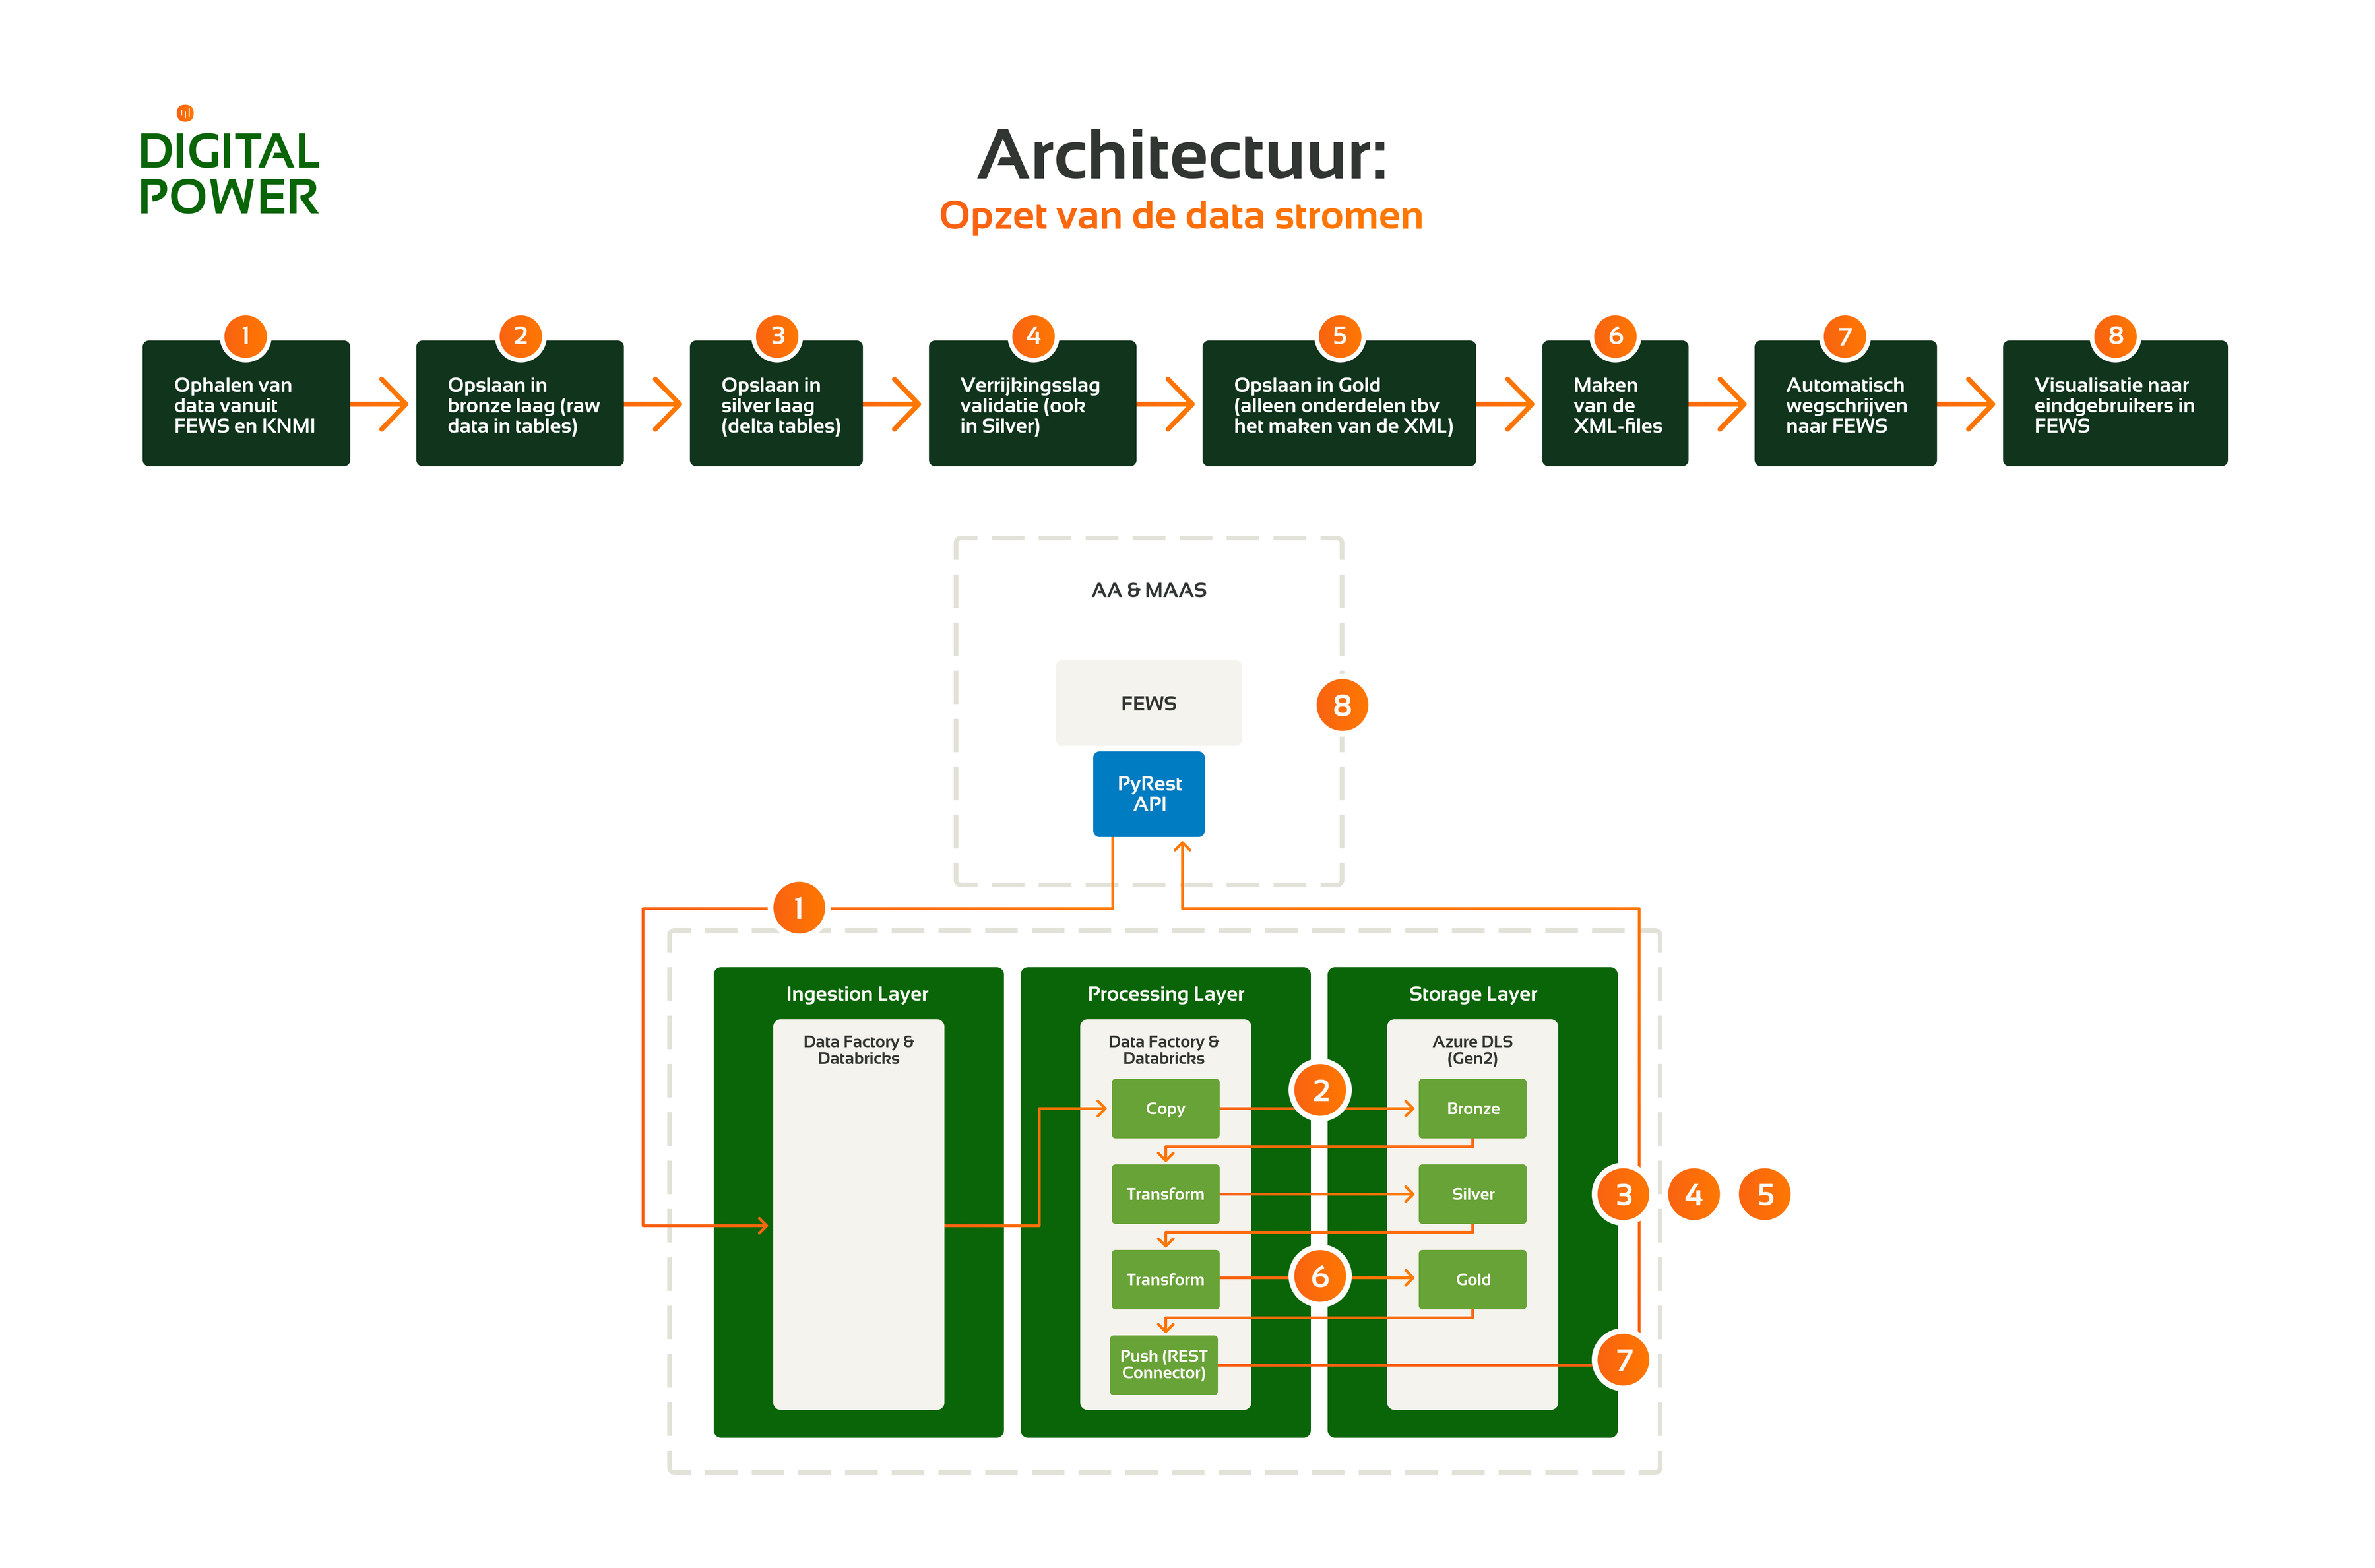
We started with accessing the data from the database using Azure Data Factory. For this we used the layered system in the data lake. The raw data is further cleaned and enriched through the three layers of bronze, silver and gold:
- In the bronze layer we make the data usable for the structure of the existing data platform. This means that the raw data is converted to a table structure. For this we used Databricks and programmed in PySpark.
- In the silver layer we validate the data quality. For this we use a Python library made by RHDHV. It contains several data science components, including a functionality to perform data validation. We collect the data from 90 sensors that take a measurement every 15 minutes. Six quality labels are added to each of those measurements. It is how we study six possible data issues. If one of these six labels is set to true, this is an indication that something is wrong with the data.
- In the gold layer we convert the data to an XML format. This way the data can be returned to the original database, which can only receive data in this format. In this way we can add the enriched data in the database. The files are then moved to the serving layer of the data lake. The database administrators have access to this layer so that they can retrieve the enriched data.
When developing the data pipeline, we took on a few extra things to increase the robustness of the pipeline:
- We recorded which sensors go through the enrichment process at what time. This way you can always see when the model has been running and which sensors and time series have been validated.
- We identified changes in the metadata of the sensors. With each run, the metadata of the sensor data is now split and it is automatically checked whether anything has changed in the properties of the sensor (Slowly Changing Dimensions (SCD-II)).
- The data is processed daily in the data platform. We built a separate pipeline that makes it possible to retrieve historical data from specific sensors. In-depth analysis is also possible.
The result
After going through the bronze, silver and gold layer, the data goes back to the original database. The data is then fully validated and enriched. The customer can see exactly which data is completely correct and which data may contain errors.
RoyalHaskoning DHV proved that it is technically possible to improve the data quality of the Aa en Maas Water Authority. We made an important contribution to this. We tested the pipeline for 90 sensors and built a fully scalable process for easy scaling in the future.
Want to know more?
Joachim will be happy to talk to you about what we can do for you and your organisation as a data partner.
Commercieel Manager Data Engineering+31(0)20 308 43 90+31(0)6 23 59 83 71joachim.vanbiemen@digital-power.com
Receive data insights, use cases and behind-the-scenes peeks once a month?
Sign up for our email list and stay 'up to data':