Storytelling using data
Transfer insights from data using a story

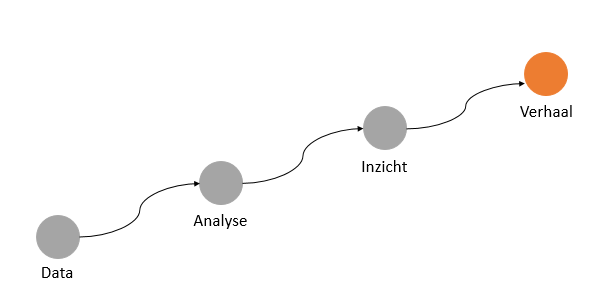
Organisations collect as much data as possible to map out the Customer Journey. After analysis, this combination of quantitative and qualitative data provides insight into the what and why of customers or visitors. These insights should prompt action. It is important to communicate the insights well, so that the right actions are taken. You can do that with storytelling.
Telling stories to convey a message is perhaps the oldest communication technique in existence. Information in the form of stories is best processed by our brains. Storytelling is therefore a widely used marketing technique. This technique is also used by organisations (the Corporate story) and managers. Using this technique is therefore actually a logical step to transfer insights from data. You can find interesting examples of this in LinkedIn. But how do you tell a story with data?
5 characteristics of a good story
1. It's about something
When you have a clear idea of the message you want to convey, you can start with your story. Then you know what is superfluous and what is not.
2. There is a beginning, a middle and an end
This sounds very easy, but it isn't. In the beginning, the atmosphere is set, characters are introduced and the storylines are plotted. The story starts with the motor moment, the event that sets the story in motion. Then follows the middle part, in which the story continues and works towards a climax. When the story ends, the denouement takes place, all storylines come together, creating a new situation.
3. It has a sympathetic main character
Your audience needs a main character they can identify with.
4. It has ups and downs, without it there is no sense of excitement
A story in which nothing happens? Deadly boring. Non-stop action? Exhausting. You have to find the right balance between action and rest. An unexpected turn and a surprising denouement will leave your audience on the edge of their seat.
5. It's addictive
A book that you can't put down until it's finished, a series that you keep watching… a good story is addictive!
These characteristics are based on an article by Christien Boomsma.
And now with data!
Can these principles be applied to a real-life example of a data analyst? Let's try it: the subject of the story is a B2B campaign in the financial industry with the aim of collecting data from prospective customers (leads). The data is collected by offering interesting content on the website, which can only be viewed after registration. Visitors are drawn through an online banner and social media campaign.
1. What is it about?
Discovery: social media is a good channel for a B2B campaign, valuable contacts can be reached in LinkedIn.
2. The construction
Beginning: the marketing department must provide sufficient contacts this year to the sales department, which aims to convert them into actual customers. A large budget has been set aside for this. As a marketing manager, Ronald is responsible for bringing in at least 3,500 contacts throughout the year. With his first campaign of the year, he wants to collect 1,500 contacts. He decides, as in previous years, to set up a banner campaign. In addition, for the first time, he wants to use part of the budget for a social media campaign.
Motor moment: valuable contacts are people like Elise, Portfolio Manager at a large organisation. Elise is very active on LinkedIn. In search of relevant information for her position, she comes across a message that arouses her interest. She decides to follow the link and registers so she can read the full article.
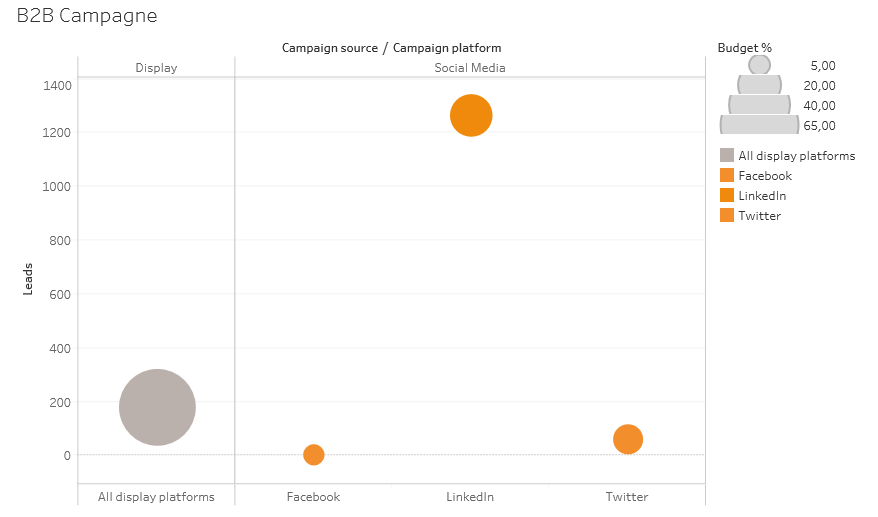
Middle: The online banner campaign that Ronald set up was expensive and not particularly successful. He used 65% of the total campaign budget for this. This resulted in few registrations.
In addition, Ronald has used social media for the first time. The expressions on Twitter have led many new visitors to the website. These were mainly short visits that did not lead to registrations. LinkedIn has attracted fewer visitors than Twitter. But the LinkedIn visitors visited the site longer and often did register. LinkedIn is responsible for a very large part of all registrations.
End: Ronald has collected very useful contacts such as Elise in LinkedIn. In total he collected 1,507 registrations, slightly more than the intended 1,500 registrations. In addition, this campaign has shown that social media as a channel, with LinkedIn as a platform, can be successfully used for future B2B campaigns.
3. Who are the characters?
Character 1: Ronald, Marketing Manager
Character 2: Elise, Portfolio Manager (probable client)
4. The ups and downs
Down: The online banner campaign was expensive and not particularly successful.
Up: Twitter has brought in many new visitors.
Down: unfortunately these visitors have rarely registered.
Down: LinkedIn has attracted fewer visitors than Twitter.
Up: LinkedIn is responsible for a large part of the registrations.
Up: thanks to the success of the social media campaign, the number of registrations envisaged has been reached.
Up: Social media and LinkedIn in particular can be used for future campaigns.
5. How does it become addictive?
The story becomes more exciting and maybe even addictive through the use of visualisations. Visualisation of data allows us to discover important patterns and connections. Data gains meaning through visualisation. Good visualisations make data understandable and attractive. Combined with a story, it becomes irresistible.
Do you want to delve further into storytelling with data? You can find inspiration at Informationisbeautiful.net and on Ted.com.
Tips for applying these steps in the daily work of a Data Analyst
- Think carefully about the message you want to put across. Make sure it is clear and omit unnecessary information.
- Provide a clear structure with a beginning, middle and end.
- Is there an appealing character you can use as a main character? When there are personas, they can be used as characters.
- Try to make your story exciting by adding a good mix of ups and downs.
- Use good visualisations.
With these tips, your story becomes a story that stays with you. As a result, the insights gained from data will not soon be forgotten. And that ensures that your audience is and remains aware of the need to take action. Getting started with storytelling based on data? Dashboarding can help you visualise and explain your data. Read here how to create a dashboard that continues to add value or contact us directly for advice.
This is an article by Marleen Persoon-Welting, Digital Analyst, DLL
Marleen is our former colleague. During her time at Digital Power, she worked as a Web Analyst on a project for Philips. She currently works as a Digital Analyst at DLL.
Digital Analyst
Receive data insights, use cases and behind-the-scenes peeks once a month?
Sign up for our email list and stay 'up to data':