Data Analyst

Apply nowApply now
  • Amsterdam
  • Den Bosch
  • 32 - 40 hours
People laughing at the office

Dive into organisations' offline and online data and visualise the insights from your data analysis in dashboards and reports. Advise on concrete action points that follow.

We are looking for a Data Analyst who is fluent in the Dutch language, both verbally and in writing.

A job as Data Analyst at Digital Power

As a Data Analyst at Digital Power, you will help various organisations make decisions based on data. Your job is to translate complex information from different domains into clear and concrete action points. Your goal is to ensure that decisions are no longer made 'on gut feeling' but based on actual data.

You will work in multi-disciplinary teams with colleagues from Digital Power and/or client teams. We believe it is important to share knowledge with each other. As a result, you develop at a rapid pace. But we also expect an energetic contribution from you! This is something you do your way, for example by providing training or coaching junior colleagues.

In addition to your assignment(s), you will be part of our internal community. Learn from and with your colleagues and help each other to become even better! Can't figure something out? If so, our entire team is there for you.

Data Analisten aan het overleggenData Analisten aan het overleggen
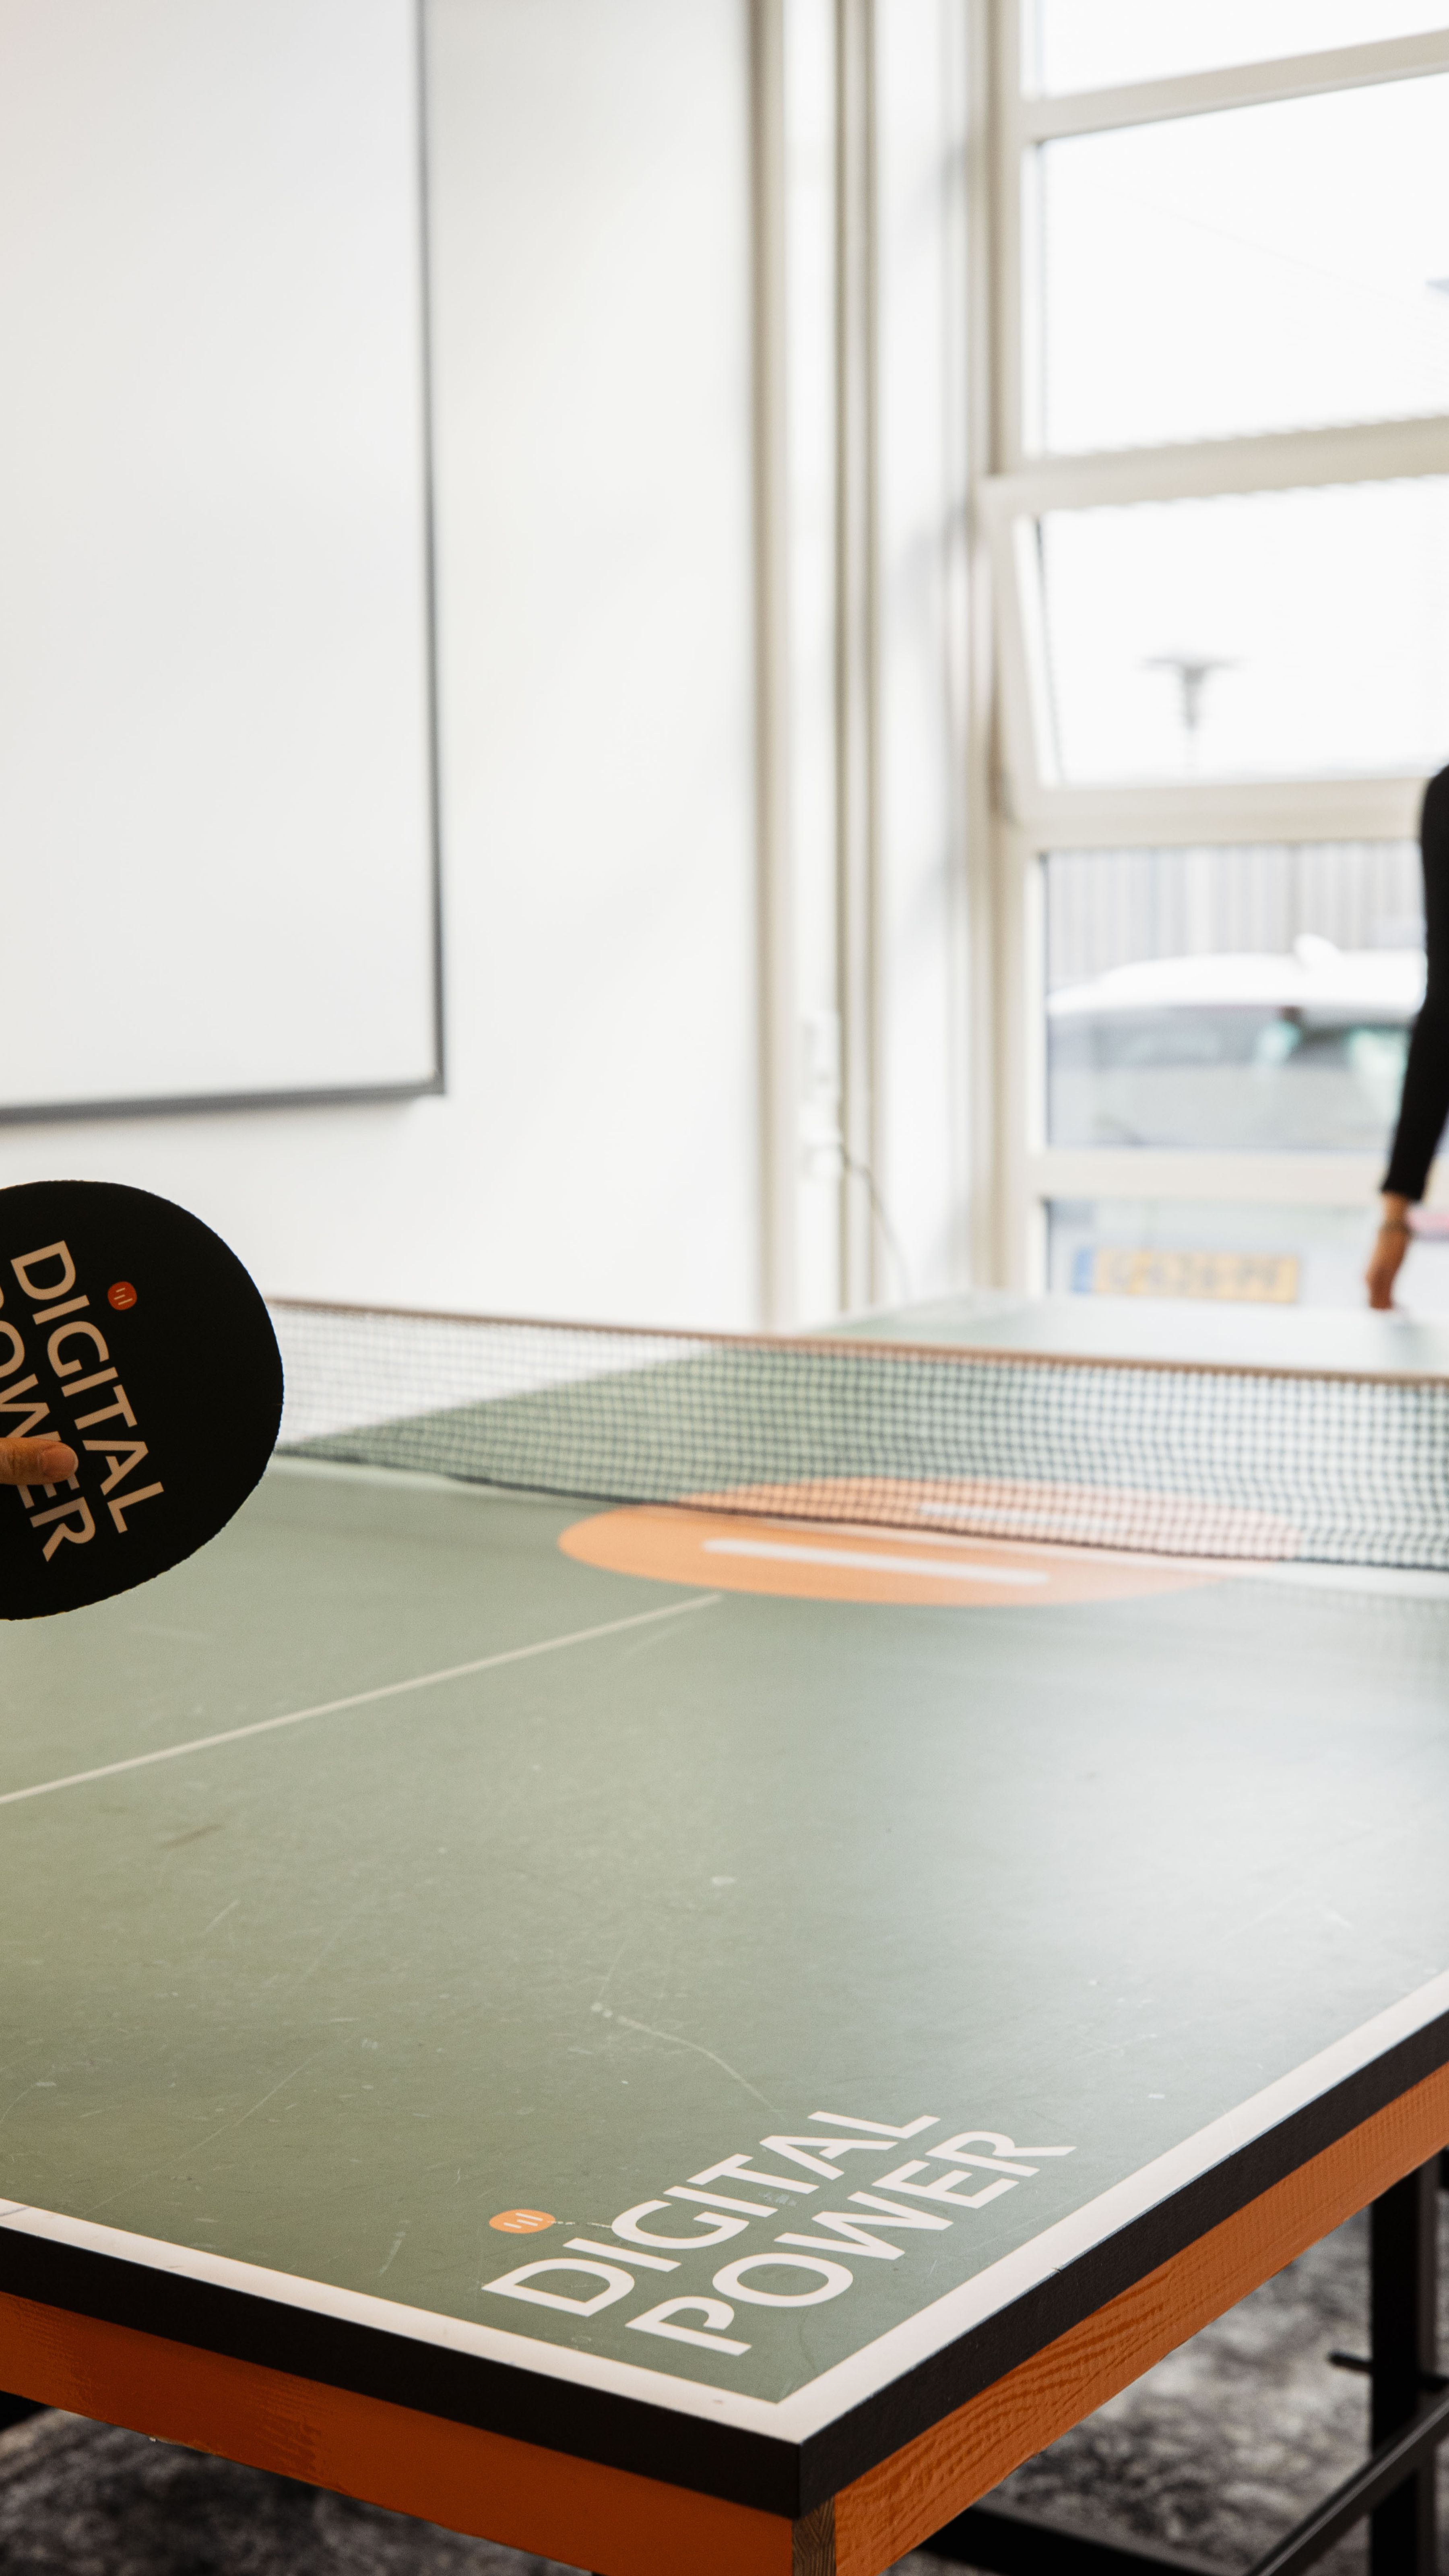
PingpongenPingpongen
Collega's met elkaar in gesprek aan twee tafeltjes op kantoor Den BoschCollega's met elkaar in gesprek aan twee tafeltjes op kantoor Den Bosch
Collega's aan het tafelvoetballenCollega's aan het tafelvoetballen
Een presentatie op kantoor Amsterdam bij de tribuneEen presentatie op kantoor Amsterdam bij de tribune
Data professionals in gesprekData professionals in gesprek
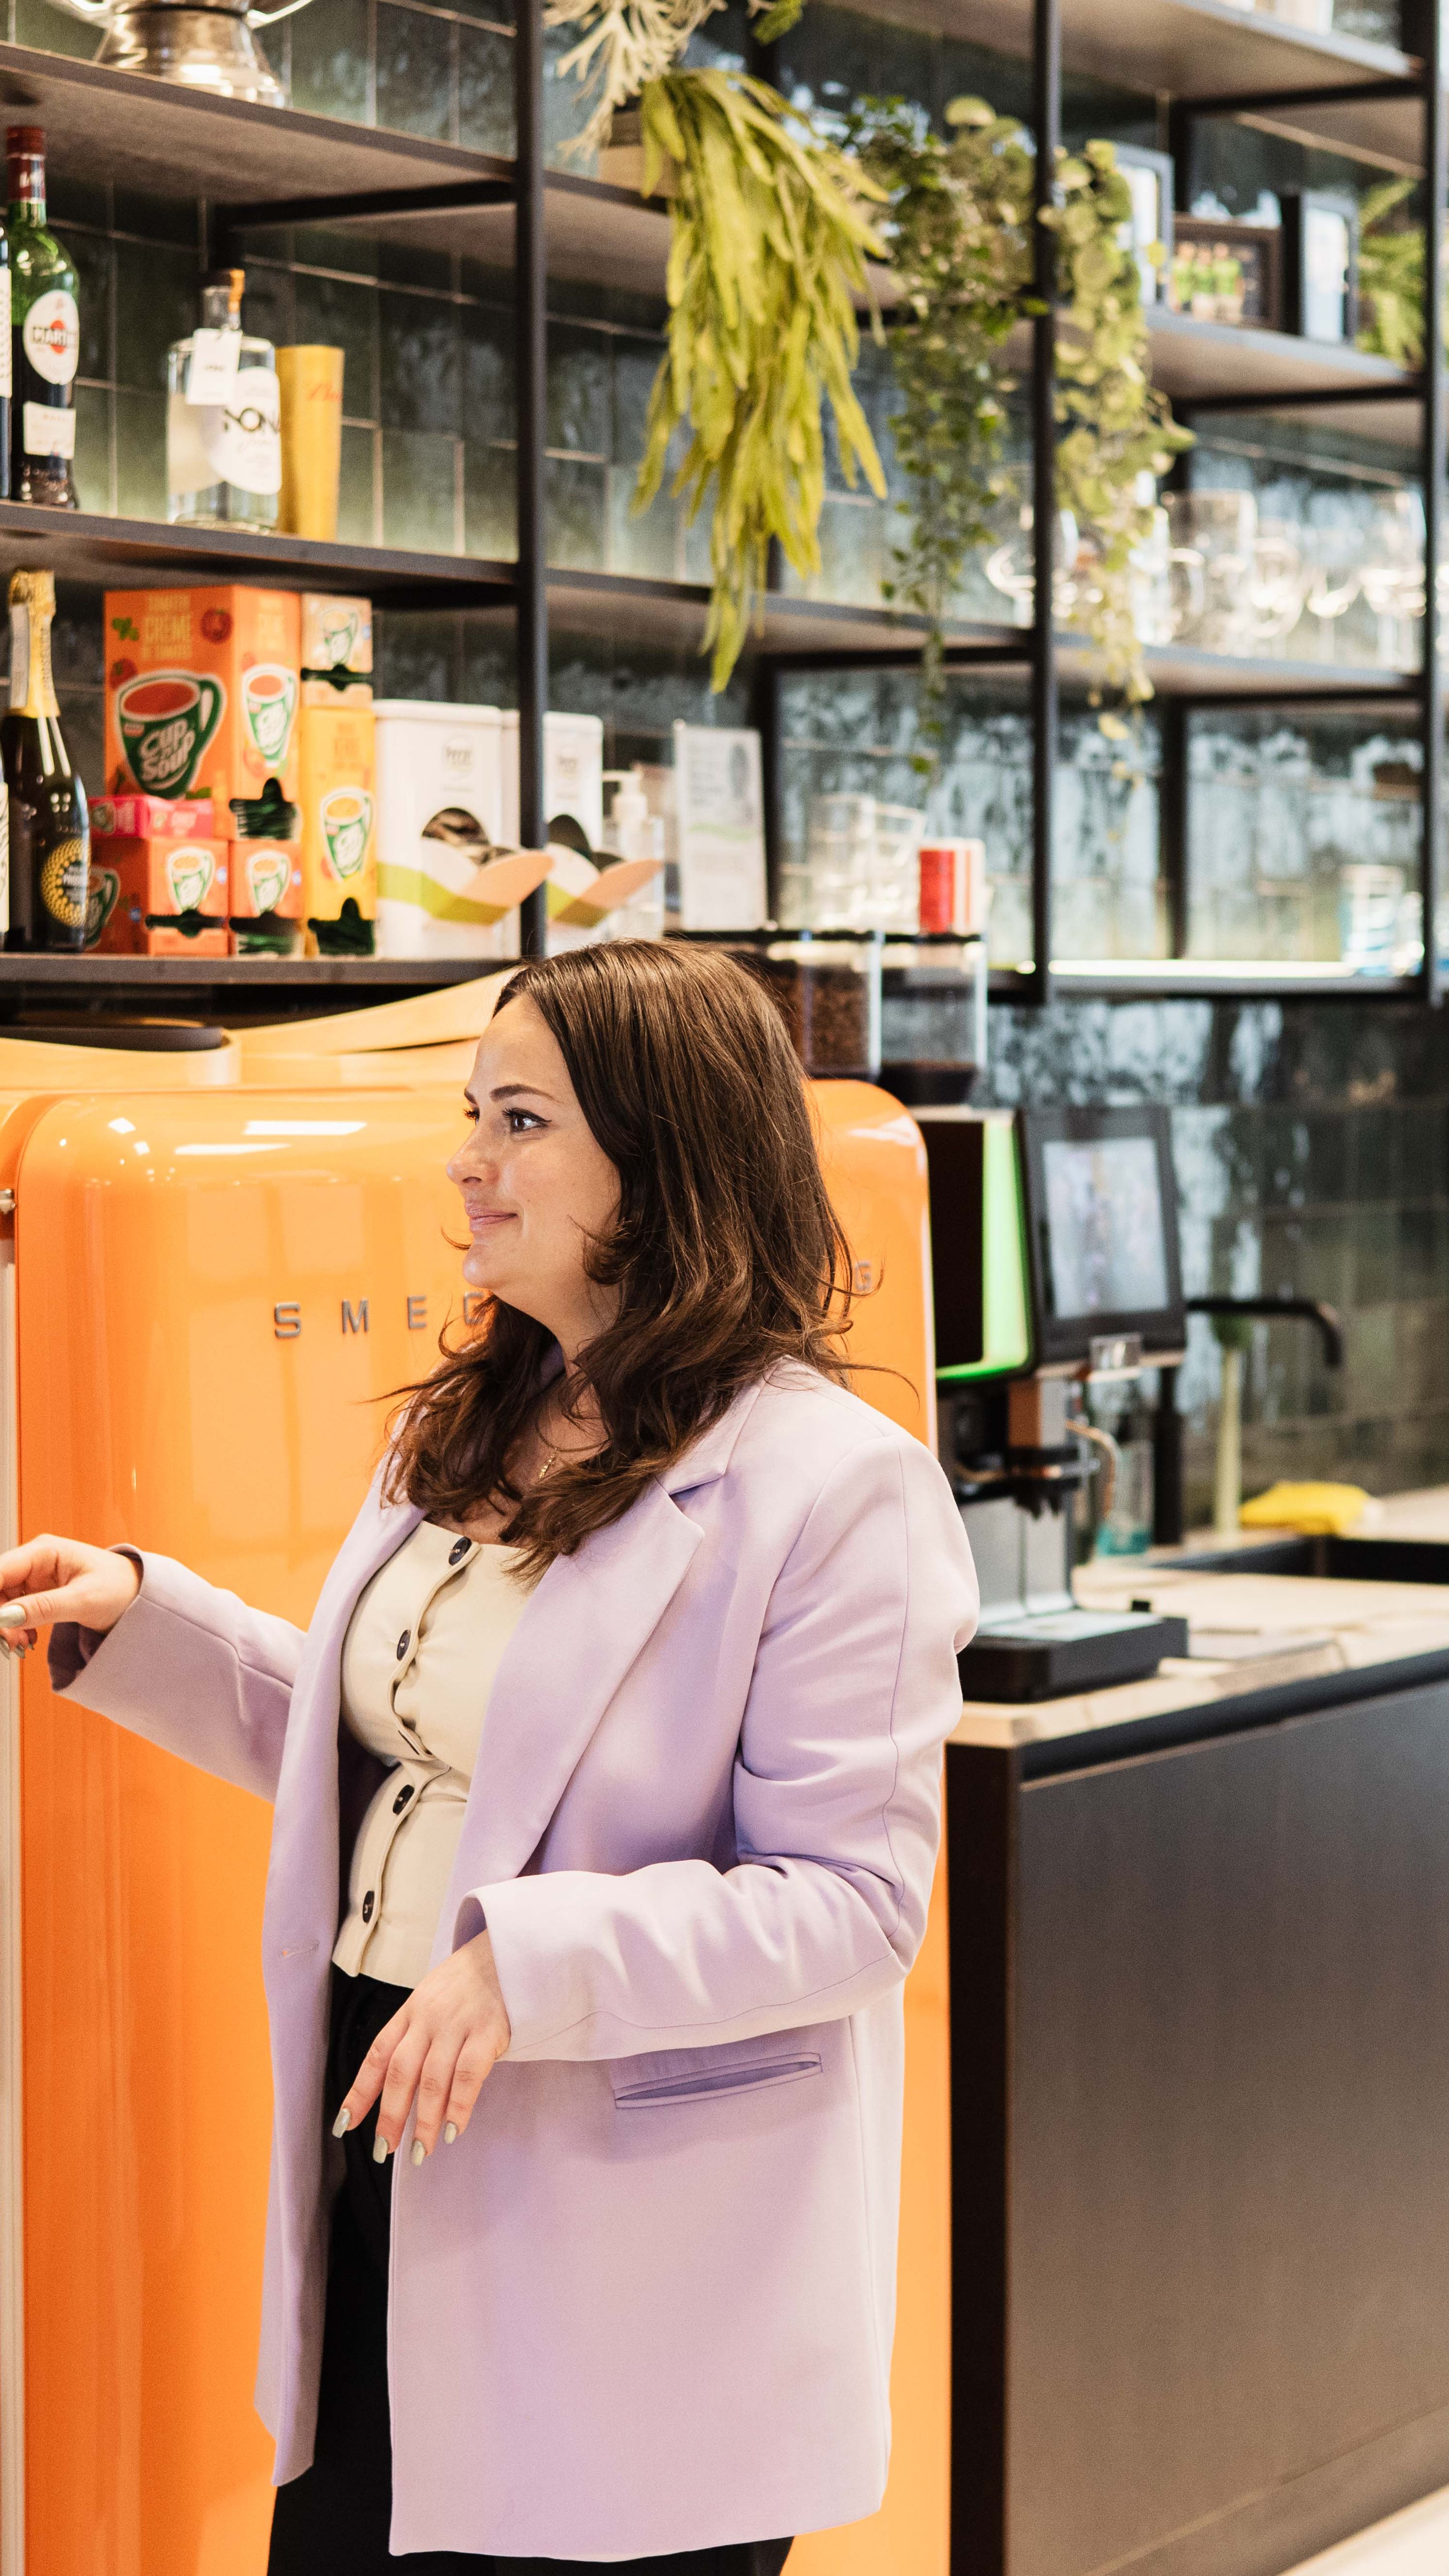
Collega's bij de bar in AmsterdamCollega's bij de bar in Amsterdam

About you

Good to know

Currently, we are only hiring candidates who are authorized to work in The Netherlands at the time of their application. We are in the process of becoming a sponsor for non-EU citizens, however, we cannot make any promises at the moment. Also, you must live in the Netherlands during your employment at Digital Power.

Passionate about data

  • You like diving into the offline and online data of organisations
  • You get energy from turning data into actionable insights
  • You can clearly analyse, visualise and explain data

Required experience

  • You have a minimum of 1 year of working experience as a Data Analyst
  • You have experience with (web) analytics and/or visualisation tools such as Google Analytics and PowerBI
  • You have strong communication skills and are able to help organisations to work (more) data-driven

What else?

  • You enjoy working for different clients: from NGOs to marketing agencies and from banks to government agencies
  • Experience with SQL is a plus
  • You consider what the question is behind the question
  • You are inquisitive and always eager for personal development
  • You think a good vibe at work is just as important as your profession
  • You get good energy from our Careers page
  • You are able to communicate in English, both verbally and in writing
  • A completed bachelor's or master's degree

What we offer

We offer a starting salary of €2800 - €4500 gross per month, depending on your knowledge and experience.

Unlimited training budget and arrange your own working hours: read here about all the other things we can offer you.

What does your day look like as a Data Analyst at Digital Power?

You start your day with a stand-up meeting, where you discuss progress and challenges with your team. After that, you continue working on the dashboard you're developing.

During lunch, you decide to head to the gym, conveniently located near the office. After a refreshing workout, you grab a sandwich on your way back.

Back at the office, you receive an ad-hoc analysis request. You're accustomed to swift action and promptly start gathering the necessary data. Later in the afternoon, you have a crucial call with a client to grasp their information requirements and uncover their preferences. You ask targeted questions and take notes to deliver the finest analysis possible.

Where you work each week is a combination of being on-site at the client's premises, working from home, and, of course, an enjoyable day at one of our offices in Amsterdam and Den Bosch. You prefer to travel by public transport: great sustainability, flexibility and free for you, even on days you are not working. Is a (temporary) car more convenient for you? In consultation, many options are possible.

Organise your working week in a way that suits you. As long as you deliver excellent work, your clients are satisfied and your colleagues can rely on you, we are happy and proud to have you as our colleague!

Do you want to work on these kind of Data Analytics challenges?

PACCAR Parts Europe

Optimised supply chain performance visibility with Tableau

PACCAR Parts Europe (PPE), a sister company of DAF Trucks, is responsible for supplying truck parts to all DAF Trucks dealers across Europe. To achieve this, PPE operates a sophisticated supply chain network throughout Europe. Currently, PPE is developing a Supply Chain Control Tower—a platform that provides full transparency of all logistical movements from supplier to dealer.

Read more
Google Analytics logo

Implementation of Google Analytics 4

An interest group for homeowners offers a wide range of content and services on its website that can be closed online. In order to serve its website visitors in the best possible way, interactions with the services, funnels and content pages must be properly measured. They already did this with our support, with Universal Analytics (GA3). To be well prepared for the future, they asked us to implement Google Analytics 4.

Read more
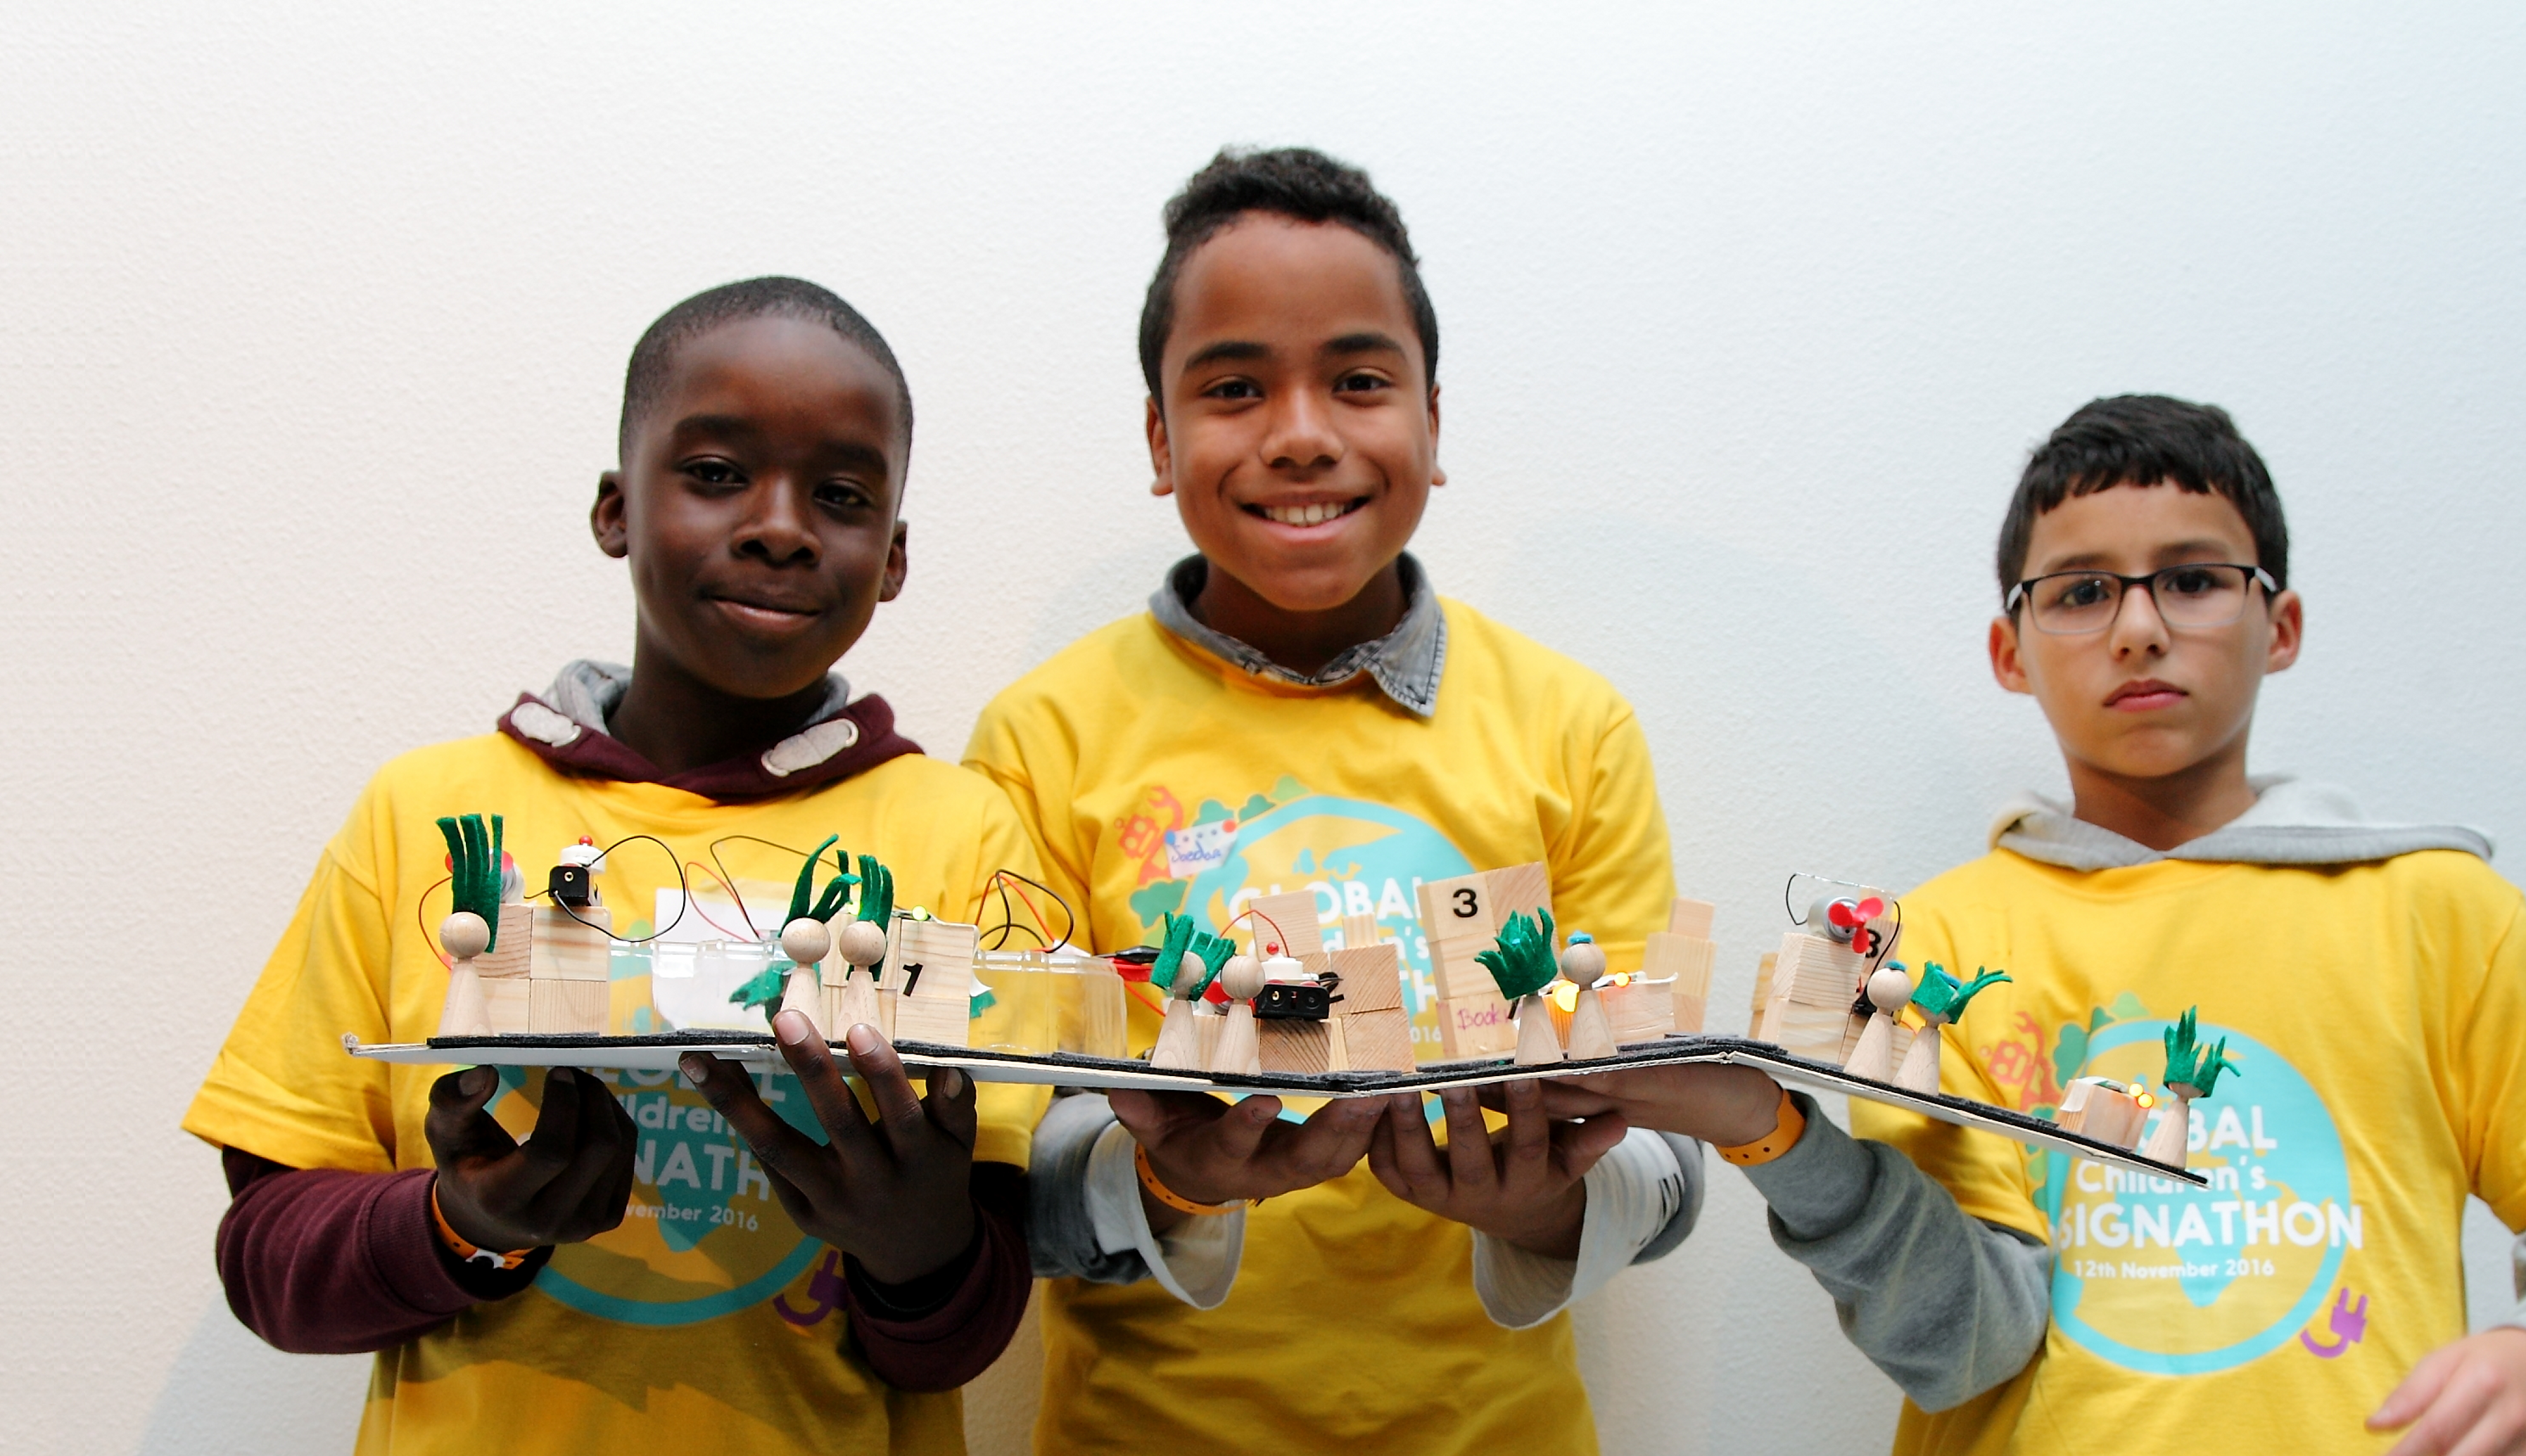
Children who participated in a designathon

Making impact measurable

The Designathon Works foundation organises Design Hackathons (Designathons) for children aged 8 to 12. The target? Teaching children from all over the world skills to become a 'changemaker'. They are challenged to design solutions for a better world, for example to combat climate change. From the Datahub, we helped Designathon Works fine-tune the impact measurements free of charge. We also made a first move towards automating data collection, analysis and visualisation.

Read more
fysioholland data

A well-organised data infrastructure

FysioHolland is an umbrella organisation for physiotherapists in the Netherlands. A central service team relieves therapists of additional work, so that they can mainly focus on providing the best care. In addition to organic growth, FysioHolland is connecting new practices to the organisation. Each of these has its own systems, work processes and treatment codes. This has made FysioHolland's data management large and complex.

Read more
Sky with clouds

Data-driven website optimisation

The well-known Dutch band HAEVN was unable to perform due to the corona measures. In order to make the most of their time, they wanted to optimise their new website and webshop. They sell merchandise, CDs and LPs through their Shopify webshop. Fans can also download concert films there. The HAEVN team themselves had little knowledge of data-driven website optimisation and asked us for help.

Read more
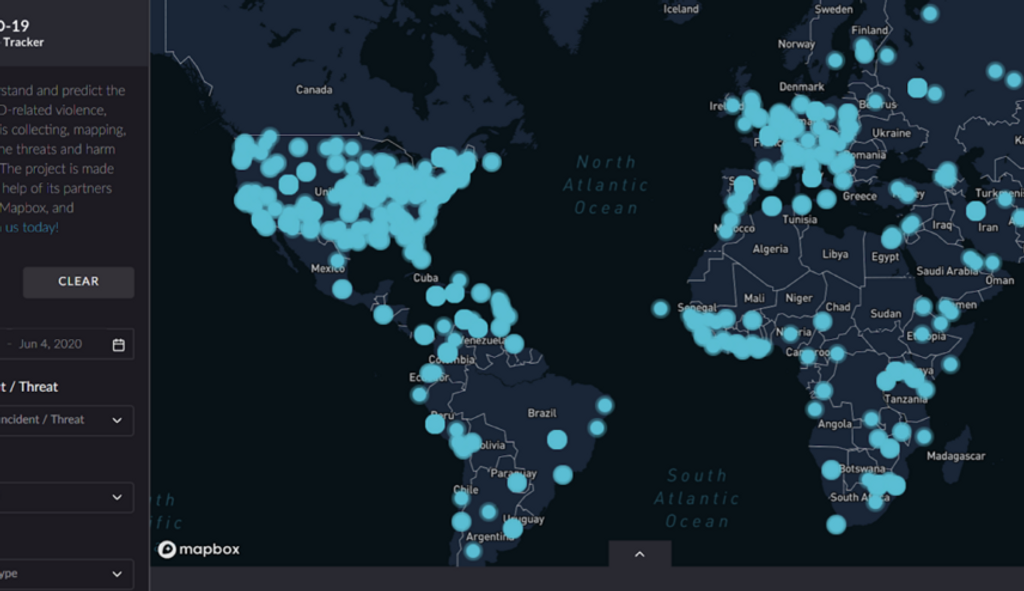
COVID violence tracker

The COVID-19 Violence Tracker

The outbreak of the corona pandemic in early 2020 has turned the world upside down. In addition to countless infections, hospitalisations and deaths, we also saw an outbreak of violence in many countries. Citizens took to the streets, sometimes violently, to protest against the measures taken, but domestic violence also increased in many places and fear and frustration played a role in racism.

Read more
covid test

Data-driven work in a crisis organisation

Dienst Testen is a crisis organisation created during the corona pandemic. Under the banner of the Ministry of Health, Welfare and Sport (VWS), Dienst Testen ensures that everyone in the Netherlands can be tested quickly and reliably. Dienst Testen does this in collaboration with the municipal health services (GGDs) and laboratories. To quickly gain insight into the corona test figures in the Netherlands, Dienst Testen asked us and a number of other data consultancy parties to create dashboards in collaboration.

Read more
KPN colors

Provide insight into cross-sell and upsell opportunities

KPN's Team Digital wondered whether more value could be gained from their existing customers. Using the available data, we looked at where – within the existing online customer journeys – there were opportunities for cross-selling and upsell.

Read more
Guy with headset behind a computer

Data-driven optimisation of offline customer service

For some time now, we have been assisting PostNL's customer service department with the optimisation of their online service & contact environment. Various pilots showed that there was also a lot of potential in improving the offline service.

Read more
baby

How a start-up starts with data-driven working

Mimic is a start-up that wants to help parents achieve the best feeding experience for babies through the Mimic baby bottle. This bottle provides the most natural drinking experience possible. Thanks to the patented cup system, the Mimic bottle ensures a calm drinking pace and reduces the risk of colic.

Read more
cycling through utrecht

Better service with the help of data

The Municipality of Utrecht collects a lot of data from contact moments with citizens. This includes anonymous visitor behaviour on the website and online applications, but also phone calls to the Customer Contact Center, messages via webcare and physical appointments at the municipal desk.

Read more
windmills

Data-driven web and customer experience optimisation

Eneco customers can enter into or change an energy contract via the website, but also purchase a charging station or hire an energy coach, for example. Eneco wanted to bring in more expertise regarding the field of digital analytics. We helped Eneco find an extra Web analyst with whom this ambition could be fulfilled.

Read more

Route to data-driven (co-)working

DIGIWEDO specialises in designing and developing responsive websites, web shops and web applications for SMEs (MKB). They regularly receive questions from customers about how to collect, visualise and/or analyse data in the right way. DIGIWEDO does not yet offer any services in the field of data. They asked us to think about how they could expand their existing services when it comes to advice in the field of data-driven working. Within a week, using our data pressure cooker we proposed a clear plan that helps DIGIWEDO to meet customer needs.

Read more
windmills

Data-driven web and customer experience optimisation

Eneco customers can enter into or change an energy contract via the website, but also purchase a charging station or hire an energy coach, for example. Eneco wanted to bring in more expertise regarding the field of digital analytics. We helped Eneco find an extra Web analyst with whom this ambition could be fulfilled.

Read more
medical gloves

Clear dashboards for the IC team during the Corona crisis

In times of the coronavirus (COVID-19), a good overview of the patients in the scaled-up intensive care of the Utrecht medical centre is vital. Employees must be able to view patient characteristics, the most current lab readings and the course of patients' vital signs at a glance. In addition, up-to-date insight into the bed occupancy per department and the capacity of the nursing staff is required. We immediately got started to provide the necessary insights for UMC Utrecht. As a way of also contributing in these times of crisis, we offered our hours free of charge.

Read more

Increased ROI in healthcare campaign thanks to improved insight

Various departments within Univé made decisions based on data from multiple data sources and separate reports. As a result, each department made decisions based on different information. The departments were also not always aware of each other's performance. We investigated how the integration of the data sources using the Microsoft Power BI visualisation tool could improve decision-making.

Read more

Data training at the Digital Power Data Academy

Venturn's consultants are active in the maritime and logistics sectors. The service provider itself organises soft skills training for their employees. In addition, there was a need for training in the field of data-driven work. Venturn asked us to develop tailor-made data training.

Read more
klantcase Fietsvoordeelshop

The proven added value for Fietsvoordeelshop

Fietsvoordeelshop has seven physical stores and a webshop. It is one of the most successful bike shops at the moment. In the field of data, the bicycle shop mainly worked with Excel. This means that a lot was done manually, every week. Due to the growth of the organisation and the increasing number of processes, the Excel file became increasingly large and unclear. Fietsvoordeelshop asked us to demonstrate with a data pressure cooker of five days that data-driven work could be of added value.

Read more

Responsible data collection and processing

From 'ethical data to doing' is easier said than done. Some of the ethical considerations in the field of working with data are laid down in the Privacy Act (GDPR). Depending on the context, there are many more questions to ask ourselves. If something is legal, this does not automatically mean that it is also ethically responsible.

Read more
app ratings analyse

Analysis of ratings and reviews of the Philips Hue app

The Internet of Things (IoT) system from Philips Hue, part of lighting manufacturer Signify, includes a mobile app. This allows end users to control their smart-home lamps both locally and remotely. They rate their experiences with the mobile app and the rest of the IoT system via Google Play or the App Store. Due to the large number of ratings and reviews, it is time-consuming to analyse them manually and recognise recurring themes.

Read more

A uniform way of data-driven working

Following a reorganisation and introduction of new strategic propositions, the main targets on the Consumers' Association website were no longer structurally maintained. Several reports from different systems were circulating. Different teams also worked on various, sometimes conflicting objectives. Working with Deloitte, we provided insight into website achievements in an accessible way and instituted a process for continuous improvement of these achievements.

Read more

Step by step data-driven working with the Digital Power Building Blocks model.

RetailTrends is a family business with a media platform for retailers. Over the years, the company has developed from a publisher of a single print magazine to a multimedia platform. This consists of two websites with news and background articles about the industry; a print magazine; an online magazine; and events. Interested parties are kept informed via various newsletters and social media channels. Some of the content is only accessible to members.

Read more
van gogh museum amsterdam

Digital transformation for cross-channel customer experience using data.

The Van Gogh Museum is the most visited museum in the Netherlands. More than 2.2 million people visited the museum in 2017. Data is collected from all those people. Data from the website and other online marketing channels, but also offline data from ticket sales at the box office, for example.

Read more
een magazine lezen op een ipad

A comprehensive understanding of the customer journey with Google Analytics and R

ONE Business websites allow users to buy subscriptions to various magazines. The online sales funnel can hereby be dynamically divided for each offer. For example, it is possible to give users free term choices or to limit them to a specific offer. Because the sales funnel is dynamic, it is impossible with the standard Google Analytics implementation to gain good insight into the customer journey. ONE Business asked us to provide insight into where people opt out and why. This will enable them to optimise the funnel for more online conversions.

Read more

More reach, engagement and online conversion thanks to insights from online content dashboards

Elsevierweekblad.nl is an online platform with news, opinion and background information. Various authors write articles on a variety of relevant topics on a daily basis. Elsevier Weekblad wanted to get a better grip on the content formula behind this. This required insight into the extent to which the types of content contribute to reach, engagement and sales of subscriptions.

Read more

Wondering what it's like to work at Digital Power?

We listed all the important questions and answers for you.

view our FAQ

Want to know more about this role?

Sandhya will be happy to tell you more about our company, our team and the challenges we can offer you.