Getting started as a data trainee with JavaScript, HTML and web data

A Q&A about Digital Power's Tracking & Analytics traineeship

  • Article
  • Technical Web Analytics
  • Working at
podcast 'from data to action'
nadine spijker
Nadine Spijker
Technical Web Analyst
3 min
31 Jul 2023

How does the Tracking & Analytics traineeship work in practice? When do you start working on real challenges for clients? And how can you develop yourself during this traineeship? Our trainee Nadine Spijker will tell you more about it.

We are currently looking for Trainees who are fluent in the Dutch language, both verbally and in writing. View our Dutch vacancy here.

Listen to the podcast below (in Dutch). Prefer to read? Scroll down a little further!

Why did you decide to pursue a traineeship?

Nadine used to work in marketing and discovered that she found the technical aspects much more interesting than the content side. "I started looking for opportunities to develop more on the technical side, and that's when my journey to Digital Power began."

During her job as a marketer, Nadine already had some experience with HTML, CSS, conducting A/B tests, and using Google Tag Manager. This made the Tracking & Analytics traineeship at Digital Power the perfect fit for her.

Why Digital Power?

What appealed to Nadine about Digital Power was the company culture: "I got the feeling that it's really about the people here, and you're not just a number or intern. Personal development is valued at Digital Power."

The feeling Nadine had before joining turned out to be accurate. "We started the traineeship with soft skill training, where we discussed topics like 'who am I, and what makes me happy?'" Additionally, Nadine quickly got to know about the unlimited education budget: "I've already made active use of it. Besides the traineeship, I've followed a JavaScript course and English lessons."

What does the traineeship look like?

The first six weeks of the traineeship were dedicated to taking courses and training sessions with experienced colleagues in the field. This allowed Nadine to get to know many people within the company. "The first week was about getting to know the company and your colleagues. In the following weeks, we had theoretical training in the mornings and applied it practically in the afternoons through a case study," said Nadine.

The following topics were covered during the training:

  • Google Tag Manager
  • Creating measurement plans
  • JavaScript and debugging
  • Cookies and GDPR
  • Soft skill training: stakeholder management, communication, presenting, and feedback
  • Ensuring flawless tracking with the right tools

After the afternoon programme, there were feedback sessions to ensure that the knowledge was properly applied. Nadine found this very helpful because it prepared her for situations she might encounter with clients.

What are your tasks with clients?

After the initial six weeks, Nadine started working at a major bank in the Netherlands under the guidance of an experienced colleague from Digital Power. She began by analysing the implemented tracking and gradually learned to lead requirement sessions and create measurement plans. "I didn't know it was possible to learn so much in one year. I didn't even learn this much during my studies," said Nadine.

Currently, Nadine still works under the guidance of a senior colleague at the bank but also receives a lot of support from other colleagues within Digital Power. "During the Friday meetups, for example, you can ask your questions or just send a message via Teams. You're never on your own."

How will you continue your development in the coming period?

Nadine has started a JavaScript course developed by a colleague from Digital Power. She plans to further develop her skills in this area.

Interested in becoming a data trainee too? Apply to Digital Power!

Do you also want to follow the Tracking & Analytics traineeship at Digital Power? Check out our job vacancy and become Nadine's colleague!

This is the 'From data to action' podcast by Marloes de Bruin, Marketing Manager at Digital Power

What is it like to work at a fast-growing data consultancy firm? In this podcast, I interview colleagues about their work at Digital Power. I speak to data consultants with different areas of expertise, as well as staff members. What does their working week look like, what challenges do they face and what do they love about their work and our company? You can hear it in the 'From data to action' podcast!

Marloes de Bruin

Marketing Managermarloes.debruin@digital-power.com

Do you want to work on these kind of challenges?

data mental healthcare

Central data storage with a new data infrastructure

Dedimo is a collaboration of five mental healthcare initiatives. In order to continuously enhance the quality of their care, they organize internal processes more efficiently. Therefore, they use perceptions from the data that is internally available. Previously, they acquired the data themselves from different source systems with ad hoc scripts. They requested our help to make this process more robust, efficient and to further professionalise it. They asked us to facilitate the central storage of their data, located in a cloud data warehouse. The goal was to set up the data infrastructure within this environment, since they were already used to working with Google Cloud Platform (GCP).

Read more
lake

Improved data quality thanks to a new data pipeline

At Royal HaskoningDHV, the number of requests from customers with Data Engineering issues continue to climb. The new department they have set up for this, is growing. So they asked us to temporarily offer their Data Engineering team more capacity. One of the issues we offered help with involved the Aa en Maas Water Authority.

Read more
Children who participated in a designathon

Making impact measurable

The Designathon Works foundation organises Design Hackathons (Designathons) for children aged 8 to 12. The target? Teaching children from all over the world skills to become a 'changemaker'. They are challenged to design solutions for a better world, for example to combat climate change. From the Datahub, we helped Designathon Works fine-tune the impact measurements free of charge. We also made a first move towards automating data collection, analysis and visualisation.

Read more
fysioholland data

A well-organised data infrastructure

FysioHolland is an umbrella organisation for physiotherapists in the Netherlands. A central service team relieves therapists of additional work, so that they can mainly focus on providing the best care. In addition to organic growth, FysioHolland is connecting new practices to the organisation. Each of these has its own systems, work processes and treatment codes. This has made FysioHolland's data management large and complex.

Read more
billboards

A scalable machine-learning platform for predicting billboard impressions

The Neuron provides a programmatic bidding platform to plan, buy and manage digital Out-Of-Home ads in real-time. They asked us to predict the number of expected impressions for digital advertising on billboards in a scalable and efficient way.

Read more
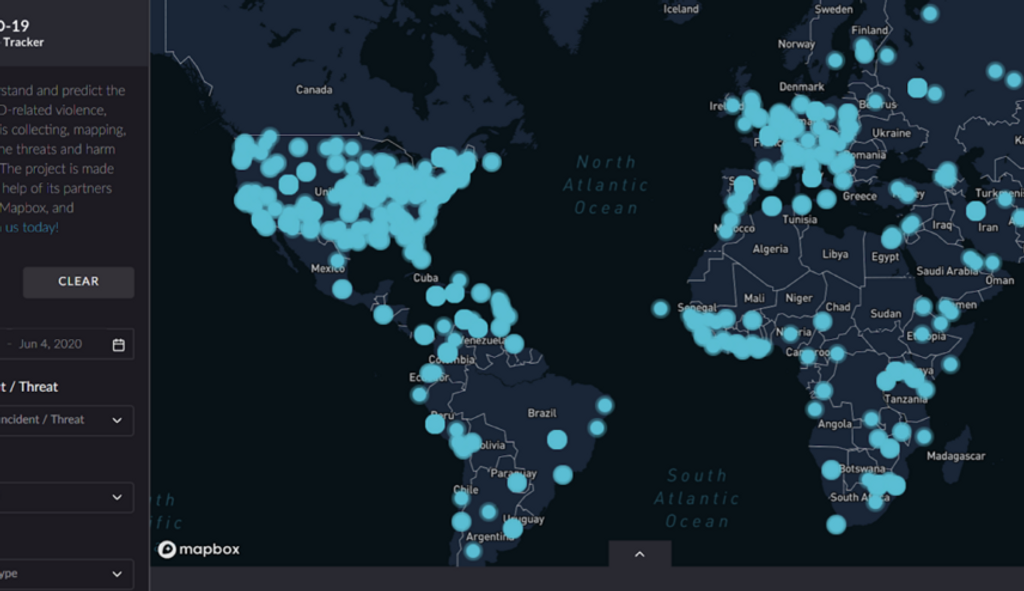
COVID violence tracker

The COVID-19 Violence Tracker

The outbreak of the corona pandemic in early 2020 has turned the world upside down. In addition to countless infections, hospitalisations and deaths, we also saw an outbreak of violence in many countries. Citizens took to the streets, sometimes violently, to protest against the measures taken, but domestic violence also increased in many places and fear and frustration played a role in racism.

Read more
baby

How a start-up starts with data-driven working

Mimic is a start-up that wants to help parents achieve the best feeding experience for babies through the Mimic baby bottle. This bottle provides the most natural drinking experience possible. Thanks to the patented cup system, the Mimic bottle ensures a calm drinking pace and reduces the risk of colic.

Read more
medical gloves

Clear dashboards for the IC team during the Corona crisis

In times of the coronavirus (COVID-19), a good overview of the patients in the scaled-up intensive care of the Utrecht medical centre is vital. Employees must be able to view patient characteristics, the most current lab readings and the course of patients' vital signs at a glance. In addition, up-to-date insight into the bed occupancy per department and the capacity of the nursing staff is required. We immediately got started to provide the necessary insights for UMC Utrecht. As a way of also contributing in these times of crisis, we offered our hours free of charge.

Read more

Measurable impact on social change using a data lake

RNW Media is an NGO that focuses on countries where there is limited freedom of expression. The organisation tries to make an impact through online channels such as social media and websites. To measure that impact, RNW Media drew up a Theory of Change (a kind of KPI framework for NGOs).

Read more
klantcase Fietsvoordeelshop

The proven added value for Fietsvoordeelshop

Fietsvoordeelshop has seven physical stores and a webshop. It is one of the most successful bike shops at the moment. In the field of data, the bicycle shop mainly worked with Excel. This means that a lot was done manually, every week. Due to the growth of the organisation and the increasing number of processes, the Excel file became increasingly large and unclear. Fietsvoordeelshop asked us to demonstrate with a data pressure cooker of five days that data-driven work could be of added value.

Read more

Digital transformation and better internal collaboration thanks to insight into offline and online data.

Publisher Malmberg collects a lot of offline and online data. More and more educational institutions are using online licenses in addition to (or instead of) printed teaching materials. To properly make use of this, Malmberg uses monthly reports. The in-house data team compiles these as input for specific departments. Malmberg asked us to strengthen this team and make the internal processes around data more efficient.

Read more

Wondering what it's like to work at Digital Power?

We listed all the important questions and answers for you.

view our FAQ

Be inspired about Technical Web Analytics

Google Analytics logo

Implementation of Google Analytics 4

An interest group for homeowners offers a wide range of content and services on its website that can be closed online. In order to serve its website visitors in the best possible way, interactions with the services, funnels and content pages must be properly measured. They already did this with our support, with Universal Analytics (GA3). To be well prepared for the future, they asked us to implement Google Analytics 4.

Read more

Measure ecommerce events in GA4 and Universal Analytics with only the updated datalayer pushes

With our variable in the Google Tag Manager Community Template Gallery it is easy to start using all the new ecommerce analytics capabilities that Google Analytics 4 offers while fully supporting the 'old' enhanced ecommerce of Universal Analytics. Find out how the variable works.

Read more

The impact of ITP on analytics and the user experience​

Intelligent Tracking Prevention (ITP) was launched by Apple in 2017 in an effort to restore "the balance the balance between privacy and the need for on-device data storage". With Intelligent Tracking Prevention, Apple aims to reduce cross-site tracking (following users across websites) by limiting the use of cookies. Find out what this means for you.

Read more

Deviating transaction figures: what are they and where do they come from?

“How many transactions did we have last week? "Let's see… Our back office says 12,000, our data warehouse says 15,000 and Google Analytics shows 11,000. "How is that possible? If different systems register and report transactions (such as back office systems, data warehouses and Web Analytics tools), you would expect the same number of orders to be registered everywhere. In practice, the numbers often do not match. Where do these differences come from?

Read more

What is Tagbird, what do you use it for, and what can you do with it?

Tagbird is a Chrome extension developed by Digital Power. You can download it from the Chrome Web Store and add it to your browser. It is a debug/visualisation tool that provides a simple and clear insight into, among other things, the data layer, tag management events and analytics requests of a website. So you can quickly and easily test your entire analytics implementation with Tagbird.

Read more

How do I set up Google Tag Manager?

A tag management system such as Google Tag Manager (GTM) enables you to measure visitor behaviour on your website. You can also implement marketing pixels (such as Google Ads and Facebook) and cookie banners via this platform. This article gives you tips to keep in mind when setting up GTM. This allows you to collect reliable and usable data, and you will be less dependent on your web developers.

Read more

Receive data insights, use cases and behind-the-scenes peeks once a month?


Sign up for our email list and stay 'up to data':