How to measure user goals in a digital environment
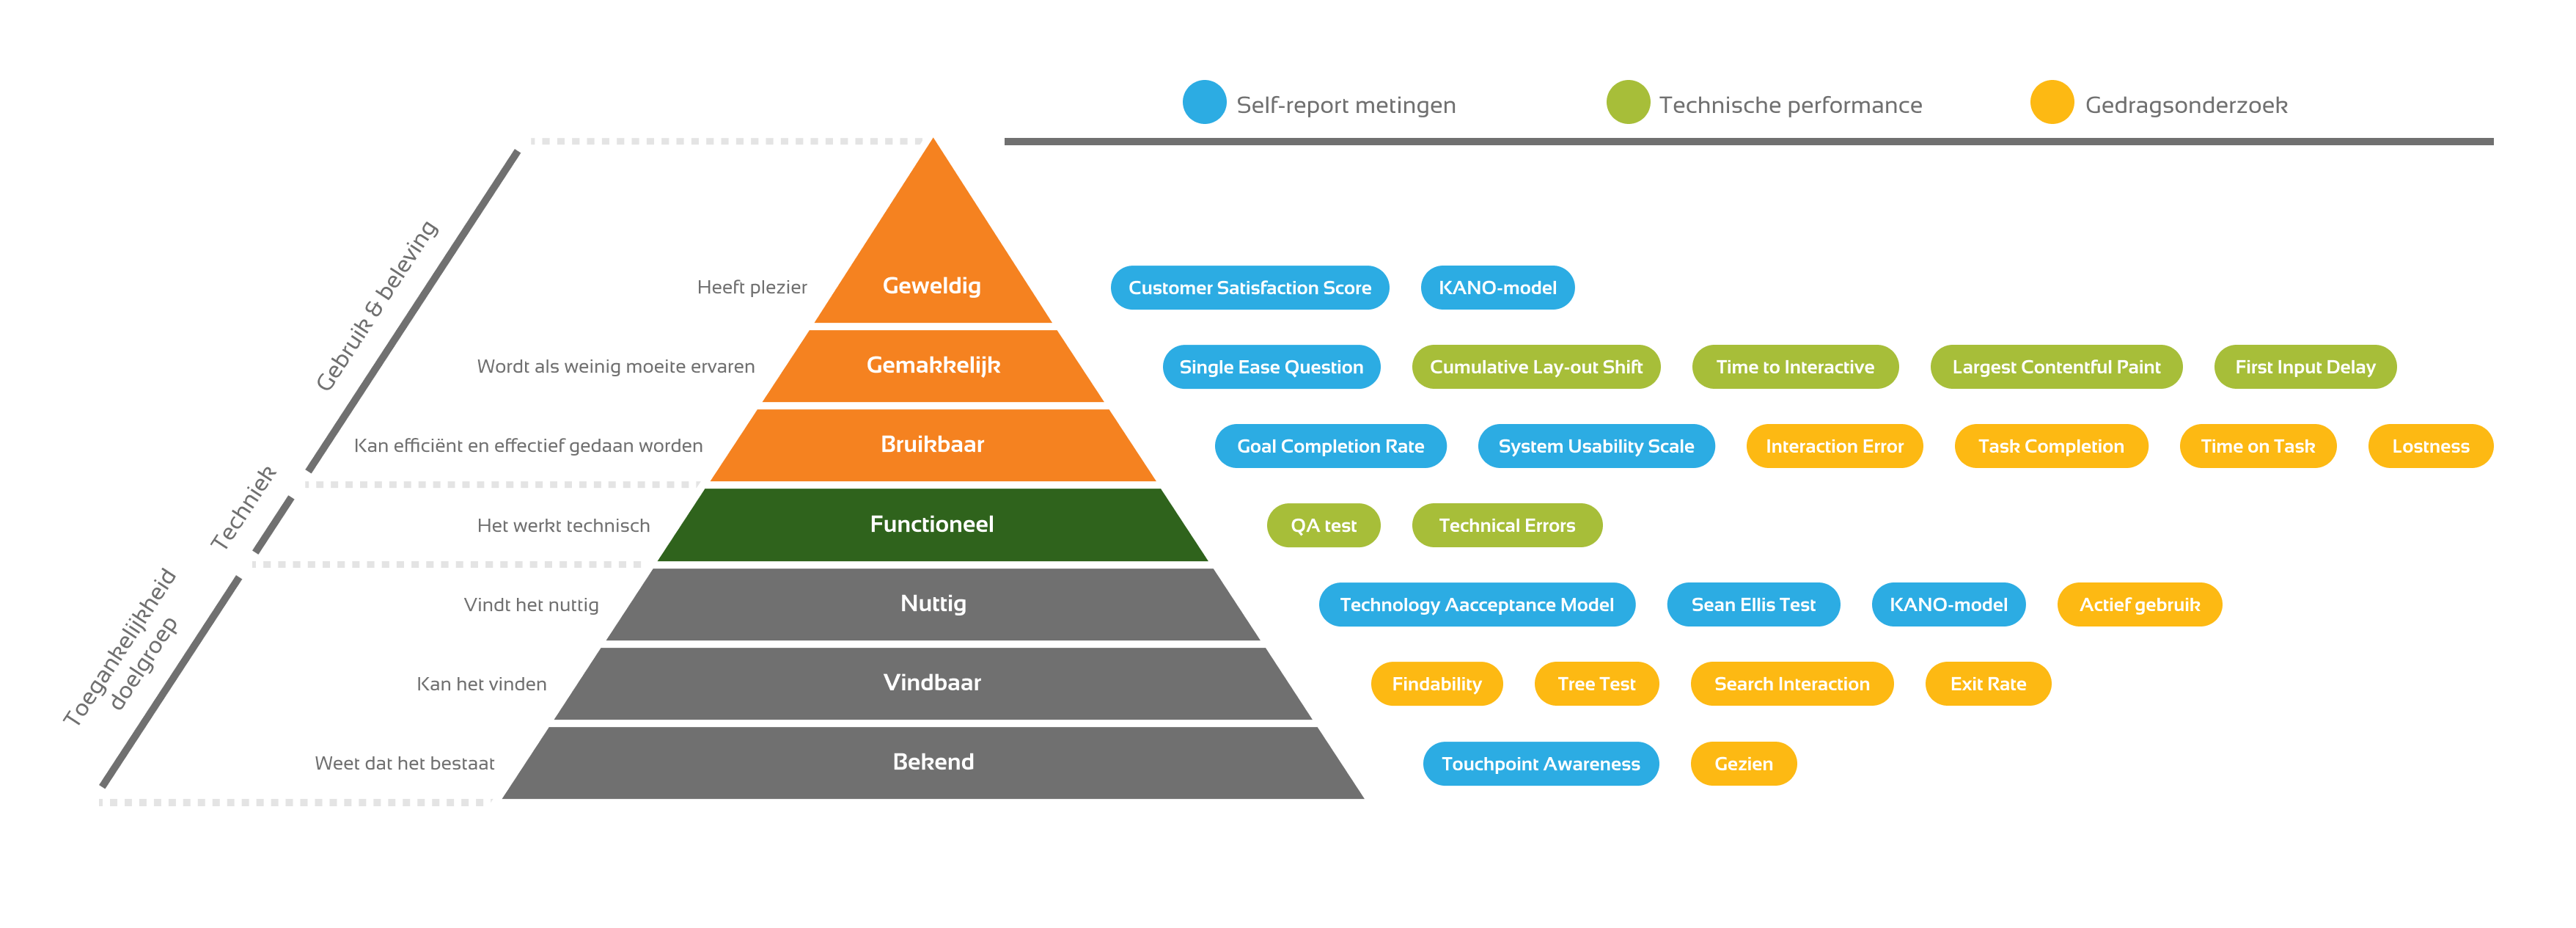
The Customer Experience pyramid

When are user goals optimally supported by a digital environment? Everyone has an idea about this, for example 'a pleasant purchase flow' or 'easy login'. How effectively you support the user is challenging to measure. However, it is everything that determines the success of your digital environment. To help you measure your success, or to check if something is missing in your current framework, we share our Customer Experience (CX) pyramid.
The CX Pyramid shares the support of user goals in layers that build on each other. Understanding and measuring these layers is key to understanding where and how to improve the user experience for maximum impact.
Familiarity
The bottom layer of the pyramid is 'Known'. If your target audience does not know what you have to offer, there can be no value exchange. Measure with potential users touchpoint awareness using a questionnaire: to what extent are they familiar with your digital environment?
Also ask current users to what extent they are familiar with features within the digital environment. Another option is to measure the percentage of users who have seen the feature through web analytics.
0 Are you aware of our my-environment?
0 Absolutely unaware (never heard of it)
0 Slightly aware of it (I've heard about it but don't know what it means)
0 Reasonably aware of it (I've heard about it and know what it means)
0 Very aware of it (I have extensive knowledge about the mining environment)
What functions in our my-environment are you familiar with?
Check all options that apply.
□ view invoice
□ change address
□ return register
□ view order history
□ set spending limit
□ cancel membership
□ view login activity
□ chat with an employee
□ other, namely __________________
Findable: can the target group find the digital environment and features?
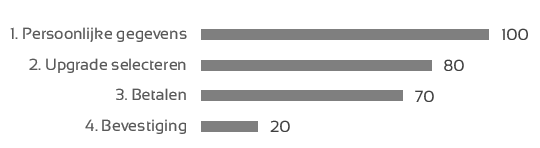
You can measure Findability by giving 20 users a task that directly points them to your digital environment or a specific feature.
For a bank this could be, for example, 'Transfer 25 euros to your friend Jan'. You can see how many users succeed, where they get stuck and how you can improve the experience. A tree test can also help even more specifically by only evaluating the information architecture of your environment.
With web analytics you can additionally measure the exit-rate on navigation pages. You can also measure in your search bar how many users click on a search result and which terms do not return search results (search interaction).
Useful: does the environment meet the needs of your target audience?
For example, you can test this as a pop-up survey with the Sean-Ellis Test. This test consists of one question, for example: 'How would you feel if you could no longer view your order history?" Users answer on a scale from 'Not disappointed' to 'Very disappointed'. This way you know whether that one feature is the right solution for your user's needs.
Models like the Technology Acceptance Model or the KANO model provide more detailed insights. The latter associated surveys are better suited to be conducted for a panel or in a user test.
You can also use analytics to measure the active use percentage of a feature or touchpoint. If it is high, many users will find the feature useful.
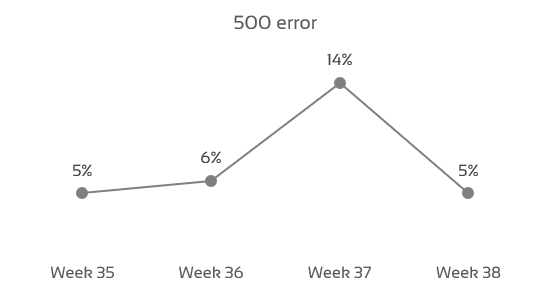
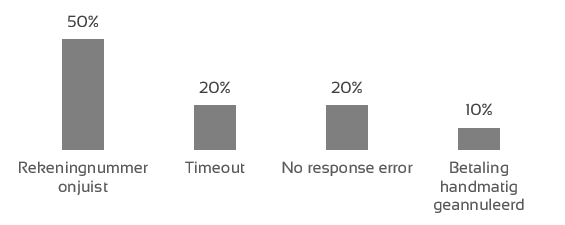
Functional: does the digital environment work technically?
Test this before each release on the most commonly used devices, browsers and/or operating systems. Measure at least the number and different type of Technical Errors (400+ or 500+). Have a Quality Assurance employee test each release whether features work properly with a QA test.
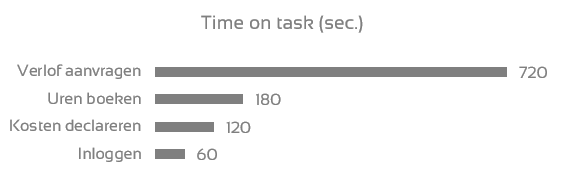
Usable: can the user achieve his target?
Measure both with analytics and in user tests:
- the time it takes to complete a task (Time on Task);
- the number of clicks the user needs to complete the task (Lostness);
- the errors that users make, such as a form field filled in incorrectly (Interaction Errors);
- how many users successfully complete a task (Task Completion rate).
You can also request the Goal Completion Rate from users with an online pop-up survey. You then ask: "Have you achieved your goal?" Users reply with 'Yes', 'In part', or 'No'.
Easy: how easy is it for users to achieve their goals?
With the Single Ease Question you capture this with a single statement, for example: "How difficult or easy was it for you to order?" Users answer on a scale from Very difficult to Very easy, so you can compare all your user goals on this score.
The System Usability Scale is more extensive with 10 statements, and more suitable for user tests. In addition, there are many technical metrics that provide insight into how easily users can interact with the digital environment, such as: Cumulative Layout Shift, Time to Interactive, Largest Contentful Paint and First Input Delay.
A handy form to measure the System Usability Score (SUS) can be found in our article about CX metrics.
Awesome
How much do users love achieving their goals? The Customer Satisfaction Score measures this with a single statement on a scale of Very dissatisfied to Very satisfied. A great experience keeps users coming back, and makes them tell others about their unique experience. The KANO model also provides insight into which features users are excited about.
How satisfied are you with the application process?
The optimal digital environment
While data will always be an indication of the truth, measuring this pyramid completely will provide many valuable insights. Besides knowing how well you perform in each layer, it is of course essential to start improving the experience. Thanks to your measurements, you can immediately see whether your improvement projects are making the right impact.
Is getting your measurements right something of a challenge? Need help interpreting your data? Send us a message and we'll be happy to help you on your way.
This is an article by Maks Keppel, Web Analyst at Elsevier
Former colleague Maks helped organisations improve their products and services through data-driven optimisation during his time at Digital Power. He is now a Web Analyst working for Elsevier Life Science to optimise digital products.
Receive data insights, use cases and behind-the-scenes peeks once a month?
Sign up for our email list and stay 'up to data':