Social Network Analysis at Election Time
Case: Super Tuesday, the Democratic primaries in America

Tuesday, 3 March 2020, was known as Super Tuesday, the day on which several American states vote simultaneously for the Democratic presidential candidate. We use this day as a case for the application of Social Network Analysis. This example is about elections, but you can also apply the same method to a commercial case where you replace the names of the candidates with, for example, different brand names.
In the run-up to elections, many polls are conducted to predict voting behaviour. But can we also use data from Twitter (an almost free source of information) to map the popularity of candidates and, thus, indirectly, the possible voting behaviour?
With Social Network Analysis, you can extract valuable insights from Twitter data; in this case, public opinion about the elections. Since Twitter is also actively used as a campaign tool during the election campaign, you can also use this data to evaluate campaigns.
Collect data
Five days before Super Tuesday, we collected all tweets that named one or more of the candidates using an @mention or hashtag (e.g. #voteforBiden).
Given that there was a lot of tweeting about the candidates, we chose to take a sample. This sample consisted of 16,380 tweets shared by the Twitterers with the most followers. We chose the Tweets of Twitterers with the most followers because they probably have the most influence on Twitter.
Results
Figure 1 shows the network of this dataset:
- The nodes (all dots) are the Twitter accounts;
- The edges (the lines between the nodes) reflect attention. Every time a Twitterer has mentioned one of the candidates, you will see a line between this Twitterer and the candidate).
Attention on Twitter is characterised by an @mention referring to a candidate (or a hashtag, for example, #BernieForPresident).
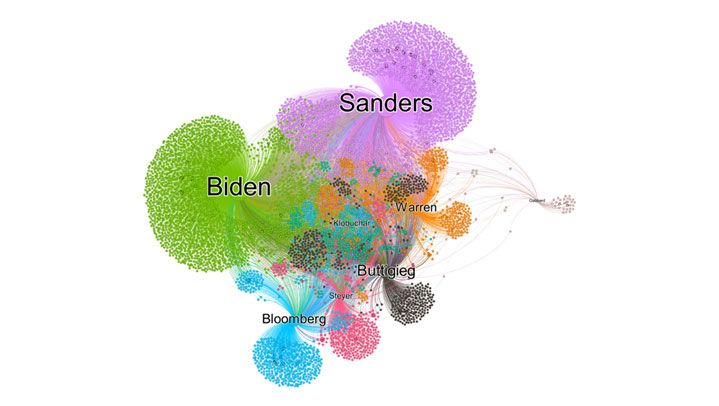
Which candidate gets the most attention? Look at the nodes
A node in figure 3 is larger the more often this Twitterer is mentioned. Biden and Sanders clearly got the most attention. See below for each candidate how often they were mentioned in our sample.
- Biden was mentioned in 5798 tweets;
- Sanders was mentioned in 6396 tweets;
- Buttigieg was mentioned in 1994 tweets;
- Bloomberg was mentioned in 1569 tweets;
- Warren was mentioned in 1402 tweets;
- Steyer was mentioned in 722 tweets;
- Klobuchar was mentioned in 718 tweets;
- Gabbard was mentioned in 156 tweets.
Furthermore, it is striking that almost all candidates have their own group of Twitterers who have paid attention to them, except Klobuchar. In figure 1, these are the clusters at the edges that are only connected to one candidate.
At the top of the network, where the green and pink nodes meet, you will see Twitterers mentioning both Biden and Sanders. On the left, between Biden and Bloomberg, you can see a group of blue Twitterers communicating about both Bloomberg and Biden (the node is blue because they mention Bloomberg more often than Biden). The same goes for other candidates, for example, Warren: a group of Twitterers mention her, but also Sanders.
Gabbard gets much less attention, and remains outside the huge network. This implies that there is a group of Twitterers that only mentions her but does not interfere with the other candidates.
However, Klobuchar is in the middle of the network. Twitterers who nominate her also nominate many other candidates.
Change of attention over time
In this case, we know that Steyer, Buttigieg and Klobuchar withdrew from the race in the days leading up to Super Tuesday. That is why we also looked at the network per day. See figure 2 below (you can enlarge the figure by clicking on it). In this figure, you can see how the attention for the candidates changes over time. The nodes remain (these are the Twitterers), and the edges come into view as soon as someone mentions one of the candidates.
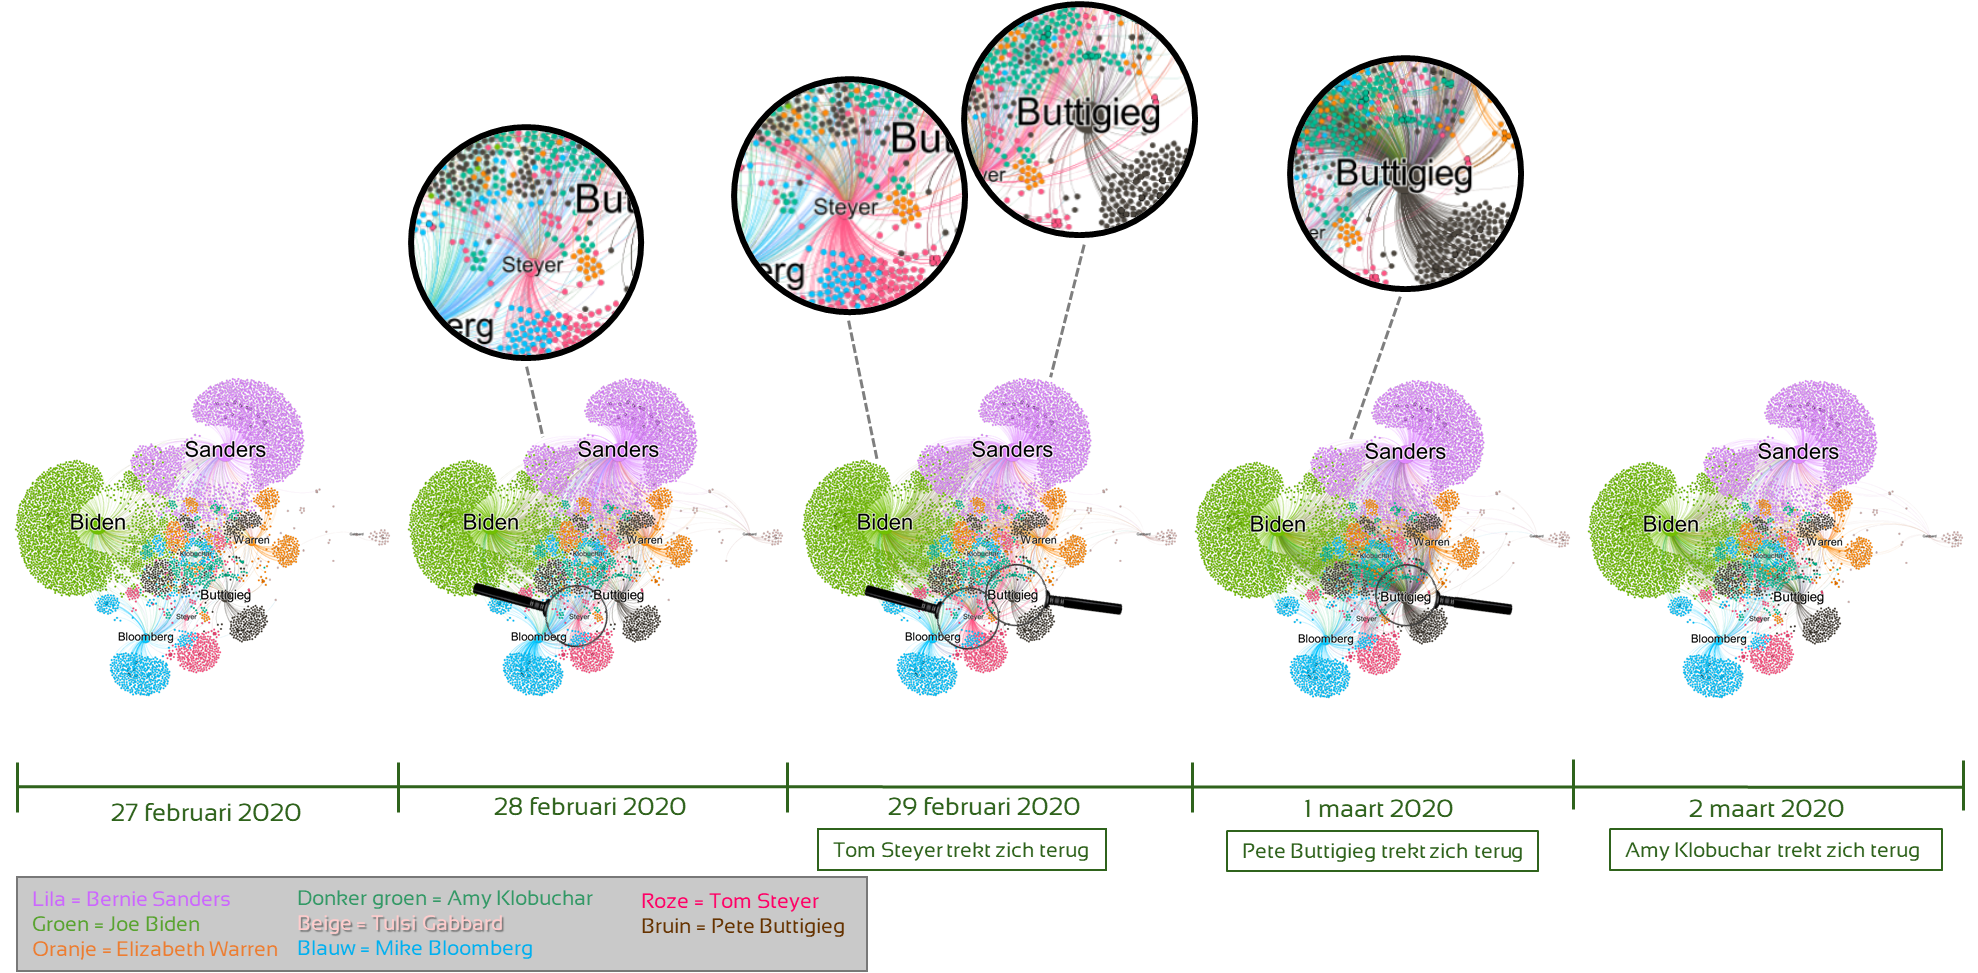
The following stands out:
- On 20 February, Tom Steyer exits the race (picture 3). On that day, there are more pink lines to Steyer than the days before and after. After he announced this news, he gets more attention on Twitter.
- On 1 March, Pete Buttigieg withdraws from the race (picture 4). Even then, one can clearly see that the brown lines to Buttigieg intensify compared to the days before and after. Buttigieg asks his fans to vote for Biden. That is why you see more green lines going to Biden from the brown cluster between Biden and Buttigieg.
- On 2 March, Amy Klobuchar exits the race. She already gets relatively little attention compared to the other candidates, and the Twitterers who mention her often also mention other candidates. We see little extra attention for her on 2 March.
Conclusion: Twitter data seems to be a good indicator of voting behaviour
If you look at the polls and the actual results, this Twitter data seems to be a good indicator of the voting behaviour of the American Democrats. Biden and Sanders were in the lead, Bloomberg and Warren were relatively evenly matched, and Gabbard received the least amount of attention on Twitter.
The focus on the candidates who withdrew before Super Tuesday (Steyer, Buttigieg, who recommends voting for Biden, and Klobuchar, who recommends the same) has been divided between the other candidates.
Next steps and advice
You could monitor this online process from the start of the campaigns to keep an eye on competitors.
In the last few days (and the days after Super Tuesday), many of the candidates have withdrawn. Tom Steyer and Elizabeth Warren withdrew without voting recommendations, while Mike Bloomberg, Pete Buttigieg, and Amy Klobuchar asked their supporters to vote for Biden when they withdrew.
Since there are clusters that show overlap in attention to the candidates (for example, in attention to Biden and Bloomberg), the candidates who withdrew might have been able to join Biden earlier to save campaign costs and join forces.
In addition, these insights could have been used to improve online campaigning. Candidates were able to find out who in this network was already active in spreading their name (the activators), who were most central (who has the most power in spreading information) and/or who had the most followers. They could then ask these Twitterers to help them with their online campaign to increase their impact.
They could also have used sentiment analysis to map out who spoke positively and negatively about certain candidates. They could have started a conversation with these Twitterers online. Pete Buttigieg has done something similar.
Understanding what's going on on social media about topics that are relevant to you?
Social media provides you with rich data, and Social Network Analysis helps you gain insight into what is happening on a large scale on social media in a relatively short time.
You could also apply this analysis to a commercial case. For example, you could map out how much attention your brand gets compared to competing brands.
Not only are these insights alone very informative, but they also provide starting points for the next steps: which aspects require further research? You might also consider applying other social listening methods to answer these follow-up questions.
Do you also want to know how to get a better grip on your social media activities? Our Data Scientists will be happy to assist you.
Former colleague Anika Batenburg was a Data Science Consultant at Digital Power
Anika has a PhD in the field of online communities. She is an enthusiastic researcher with knowledge of statistics, research design, online networks, and automatic text analysis. She is interested in the complete picture, and therefore likes to think along with the organisation on a strategic level.
Receive data insights, use cases and behind-the-scenes peeks once a month?
Sign up for our email list and stay 'up to data':