Is your product really being used?
How to analyse usage with the Product User Activity Model

You have worked with your product team on developing a new product. You have certain expectations of how users will use the product. The only question is: is this really the case? Are they using the product as you imagined? Who is using the product and who is not? In this article we discuss the Product User Activity Model. This model gives you more insight into the current and potential use of your product to take targeted action for growth.
For valuable growth of your product in terms of customers and usage, it is essential to map your users and their behaviour. Retention can mean different things. For example, for a platform with a business model involving attention and advertising (social media, free news websites) this could be about recurrent visits and for digital products such as Netflix about the people who remain customers. With retention, the question is often looked at: did they stick around?
Retention numbers alone are not enough
If you only look at whether users/customers stick around (the product is opened, or whether people are still paying), you as a product team are overlooking something important. In practice, not everyone uses your product as actively as you would like.
What good is a tool that is sporadically used by the employees? Or when someone watches a series or movie on Netflix once every two months? Or post a note in your note app once a month? Is that really how this was conceived with the product team? We know this much: they may not deliver the value your product team envisions.
When customers continue to pay, it does not mean that value is being extracted from your product. Providing insight into and classifying the different types of use helps map out the situation and take more targeted action. When a user does not use your product, you can lose him as a customer. After all, what is the reason to remain a customer? The Retention Lifecycle Framework already provides a good insight into whether use is made.
Understanding retention with the Retention Lifecycle Framework
The Retention Lifecycle Framework in Figure 1 below is designed to divide your current users into four different groups based on retention behaviour. First encountered in a blog by Jonathan Hsu about User Growth. This model can be easily processed in a tool such as Adobe Analytics.
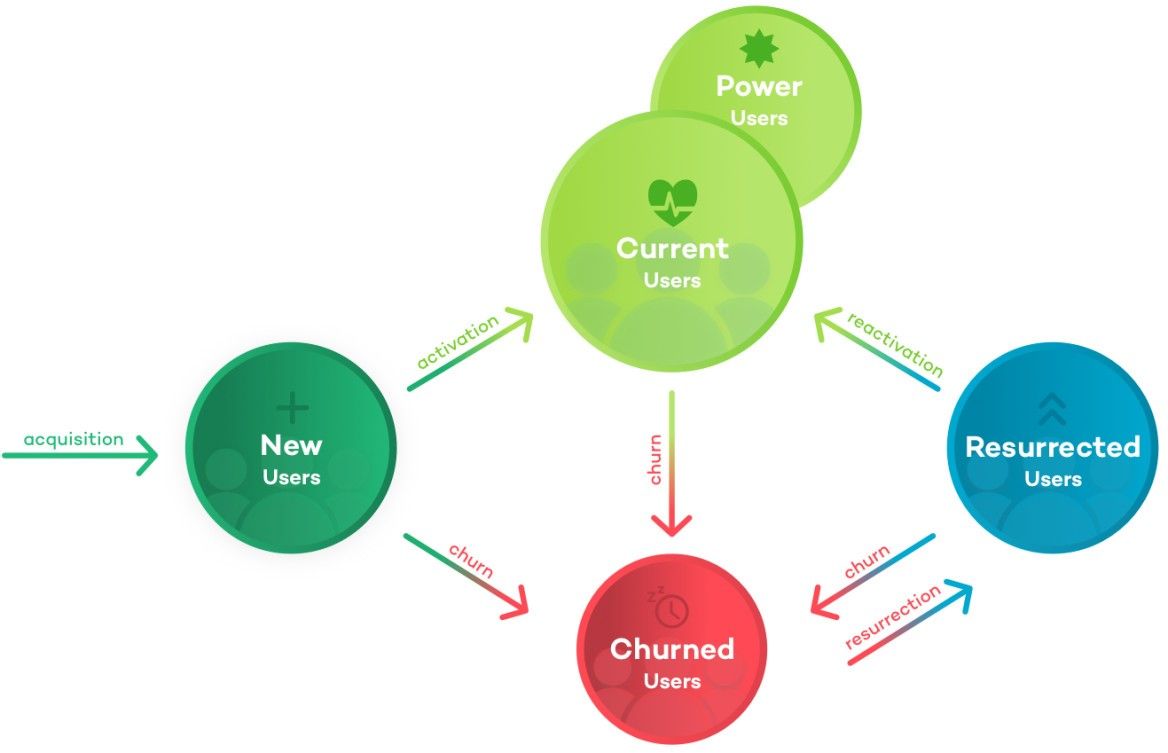
- New Users are users who are using your product for the first time.
- Current Users are users who have been using your product consistently for some period of time.
- Churned Users are users who were once actively using your product and then became inactive.
- Resurrected Users are users who were once actively using your product, who then became inactive for a period of time, and then became active again.
The Retention Lifecycle Framework (hereafter: RLF) looks at surface retention behaviour based only on time. You can divide the periods into, for example, weeks or months, depending on the product and the usage cycle. For example, you can divide the users of the current month into groups.
Although the RLF provides clear insight into the distribution of the number of users in each group based on time, you cannot fully determine how healthy the situation is. That is why we also recommend working with a Product User Activity Model. This allows you to look specifically at the activity of the user.
When you apply both models, you get a clear picture of the status of users. Based on this, you can take appropriate actions.
Insight into usage with the Product User Activity Model
Do you want insight into the use of your product?Then you can use the Product User Activity Model (see figure 2). This model makes it possible to classify users based on activity within the product.
Map your users per customer segment or persona based on the Product User Activity Model. Take into account your revenue model and any other important dimensions that influence usage. Like when you have a Freemium model, or if your product has several different user groups or completely different user goals.

The Product User Activity Model consists of two distinct phases represented in the horizontal dimension: onboarding and usage. In addition, desirable behaviour is placed at the top and undesirable behaviour at the bottom, with the ending point being the churn (customer churn). To make the model more conclusive you should define your onboarding period. This way you avoid having an overlap between onboarding and usage.
Phase 1. Onboarding
- Opened: the application is opened, no further meaningful activity.
- Exploring: meaningful activity but not activated.
- Activated: having extracted value from the product, linked to the step to Active.
Phase 2. Usage
- Power: users who are more than 'Active'.
- Active: users who derive value from the product in a certain pattern.
- Passive: sporadic use, do not extract much value from the product.
- Unknown: other usage that does not fall within the defined user groups.
- Inactive: payment is made but the product is not used.
- Churn: also called 'loss'. These are customers that you lost because they no longer paid for your product or, for example, no longer log into your platform.
Activated should have a relationship with Active, and Active should have a relationship with a valuable customer relationship. For a B2E application, Active should generate value through the activity in the tool itself and not directly through retention.
Unknown
It is also important to recognise the possible unknown behaviour that falls outside the other classifications. This is also a form of usage. Think of users who often use the product, but not as it is initially intended from the organisation. When you draw up your definitions from the data, you will encounter this group.
Inactive & Churn
In addition, it is possible that a product with which you earn money from the attention of users (for example via advertising costs) is not actively used. In this case Inactive includes customer churn and you can merge the groups. The model is a starting point from which you can define the different groups.
Examples
Online video content website with advertising revenue model
Phase 1. Onboarding: period 1 week
- Opened: opened, but no video watched
- Exploring: Watched 0-4 hours of video
- Activated: Watched >4 hours of video
Phase 2. Usage: 2 weeks' cycle
- Power: Watched >14 hours of video
- Active: watched 5-14 hours of video
- Passive: Watched 0-5 hours of video
- Inactive & Churn: Watched 0 hours of video
Note app with subscription earning model
Phase 1. Onboarding: period 2 weeks
- Opened: no note made
- Exploring:
- Activated: =>3 notes made
Phase 2. Usage: 2 weeks' cycle
- Power: >15 notes made
- Active: 5-15 notes made
- Passive: 0-4 notes made
- Inactive: no notes made
- Churn: subscription cancelled
Many report and steer on a fairly undefined and abstract metric 'Users'. In the above way you can get a good idea of the actual usage. And you can then take appropriate steps!
It is important not to make your definitions too complex. It is not an easy job, but something this brings you back to the questions about the exchange of value between your organisation, the product and the user. An action (or combination of), frequency (or duration) and a time period should always be included.
Look beyond retention!
When you look not only at retention numbers, or the structure of retention based on time as with the RLF, but also at users' underlying behaviour, important insights arise. Ultimately, it's about understanding why and how users move between different groups.
It's not just about the current status, but in fact the dynamics between the different user groups. Any line you draw between the different groups can be interesting to explore. The focus is often on the line from the onboarding phase to Churn or Inactive and from Active to Churn or Inactive (Figure 3).

- Why does a user go from onboarding to Churn or Inactive?
- What groups does the Churn consist of?
- How will you get a group of users in motion?
- What motivates and encourages people to go from Inactive to Passive or Active?
- Why do users get stuck in the Explore phase?
- What can we do to better connect with this group?
Based on research, you can answer these questions and take targeted action.
Each product will need its own definitions to gain insights that you can act on. This is because each product provides value to the user and/or organisation in its own way. When you understand all this, you know where you stand and you can take targeted action to see whether you can get certain groups in motion.
Create better products using data
Do you want to understand better how to use your product using product analytics? Exchange ideas on how to draw up definitions of usage? And do you want to learn how to translate those insights into improving your product, ensuring satisfied customers?
This is an article by Bastiaan Boel, Customer Experience Specialist at Digital Power
Bastiaan's mission is to make better digital products. He has extensive experience in measuring and optimising apps at organisations such as KLM, Interpolis, KPN and Philips.
Customer Experience Specialistbastiaan.boel@digital-power.com
Receive data insights, use cases and behind-the-scenes peeks once a month?
Sign up for our email list and stay 'up to data':