Data-driven work in a crisis organisation
Dienst Testen
- Customer case
- Data Analytics
- Data consultancy


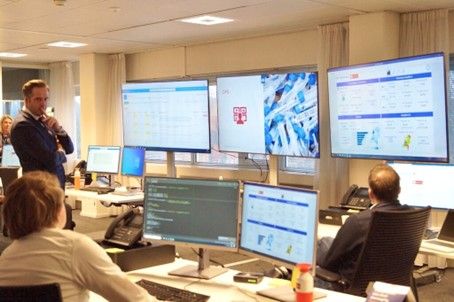
Dienst Testen is a crisis organisation created during the corona pandemic. Under the banner of the Ministry of Health, Welfare and Sport (VWS), Dienst Testen ensures that everyone in the Netherlands can be tested quickly and reliably. Dienst Testen does this in collaboration with the municipal health services (GGDs) and laboratories. To quickly gain insight into the corona test figures in the Netherlands, Dienst Testen asked us and a number of other data consultancy parties to create dashboards in collaboration.
We soon ran into difficult questions. Because how do you make the connections between more than 200 test streets and about 50 laboratories without data? How do you ensure that you buy enough material, but not too much? How do you guarantee the quality of all the different types of tests? In this customer case we explain how we started the dashboard building process.
Our approach
Normally we develop a dashboard based on the mission, vision and goals of an organisation. We set up a database, link automated data flows and visualise the data in a dashboard. With this assignment we had to approach it differently. There was, in fact, an immediate (urgent) need for information, while the foundations of the Dienst Testen organisation had not yet been established. Nevertheless, the teams already required insights on which to base important decisions. To meet this wish, we began step-by-step in 3 phases:
Phase 1: we quickly created insights by expanding an existing dashboard with newly requested information. At the start of the assignment, the source data even had to be downloaded manually every morning from the IT system of the GGD GHOR (the umbrella organisation of the GGDs and Medical Aid Organisations in the Region), CoronIT. This dashboard was also a collection of quickly set up reports without a clear link to established goals and Key Performance Indicators (KPIs).
Phase 2: we developed a new dashboard that matched the needs of the organisation. This dashboard was still without an automated database, as waiting for this would result in months of delay. We developed this second dashboard using a clear step-by-step plan:
1. Determining the story
We determined the KPIs, linked to the goals set by the Ministry of Health, Welfare and Sport. In addition, it had been determined who the target group of the dashboard was.
2. Retrieve wishes from stakeholders
We collected the requirements. For example, the design of the dashboard, functionalities and the structure.
3. Sketching and designing
The requirements determined in step two were included in sessions with stakeholders in which a sketch was made for the functional design before proceeding to development.
4. Iterative development
After approval of the functional design, we moved on to iteratively developing the dashboard in PowerBI. Then we phased out the old dashboard. The dashboard is hosted from PowerBi to Microsoft Teams and thus made available to the entire organisation.
The above step-by-step plan is a cycle in which all steps are repeated over and over again. The dashboard is always evolving and is constantly being improved. This is very important at Dienst Testen, considering the fast-growing and dynamic environment.
We are now working on phase 3: the goal in this phase is to serve automated dashboards tailored to each team individually. A precondition for this was the automatic link with CoronIT, the most important data source from the GGD GHOR. The engineers are also busy loading other resources into the Azure database. Such as the purchasing system and the financial system, in order to also build dashboards for those teams that are tailored to their goals.
The result
Dienst Testen can use the dashboards to manage the most important figures on a daily basis. They can monitor deviations in the test landscape, gain insight into the performance of certain regions or labs, monitor laboratory capacity and map their purchasing process and financial situation. And all in a centralised place.
The future
With the work that has already been done and the work that is yet to come, the foundation is being laid for functioning as a completely data-driven Service in the future. Dienst Testen will be scaled down when the corona pandemic is over, but this foundation can be used again in case of another pandemic. The next step is to transfer the complete infrastructure to the VWS environment. In this way, our work can also be set up for other services of the ministry.

Want to know more?
Reimer will be happy to talk to you about what we can do for you and your organisation as a data partner.
Business Manager+31(0)20 308 43 90+31(0)6 83 69 07 78reimer.vandepol@digital-power.com
Receive data insights, use cases and behind-the-scenes peeks once a month?
Sign up for our email list and stay 'up to data':