Social listening in the real estate market
Vesteda
- Customer case
- Data Science
- Data projects


Vesteda was curious if social listening – monitoring and analysing social media discussions about a brand, competitors, products or hashtags/keywords – could add value to the organisation. To this end, we started a project that consisted of two parts: exploring possibilities for social listening in the Corporate Communication department and applying social listening in an ongoing Data Science project.
Our approach
Opportunities for social listening in the Corporate Communication department
Vesteda already uses tools for social listening, namely Meltwater and Hootsuite. With the help of Meltwater, Vesteda collects data on various themes, such as the "Dutch housing market" and "Corporate Social Responsibility".
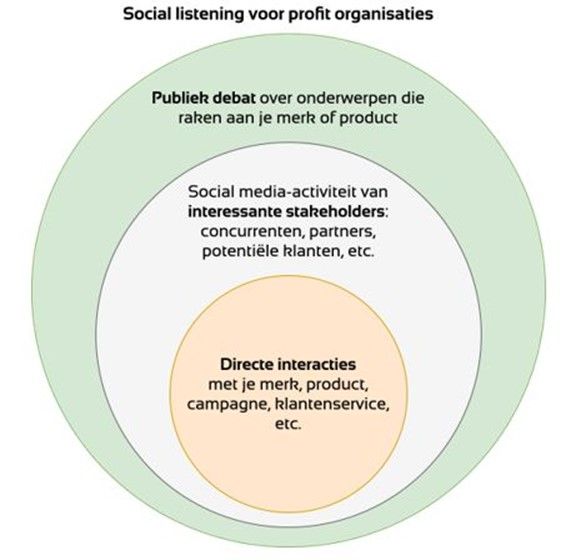
We plotted the existing infrastructure on the three levels of social listening and looked for opportunities for improvement. An example is the search query "Dutch housing market" in the online media segment: this query belongs on the 'public debate' level. Here we discovered that at the public level, only online media was looked at and not yet social media.
To be able to respond more quickly to discussions about, for example, sustainable housing, we recommended adding a search query that also looks at social media in addition to online
Using social listening within a Data Science project
In addition to exploratory research into the possibilities of social listening, we simultaneously applied the method in the 'neighbourhood score project'. This project's objective is to develop a predictive model for the investment potential of neighbourhoods.
Such a model, if successful, can be used to support the selection of neighbourhoods to invest in. The model consists of several variables that together form a neighbourhood score.
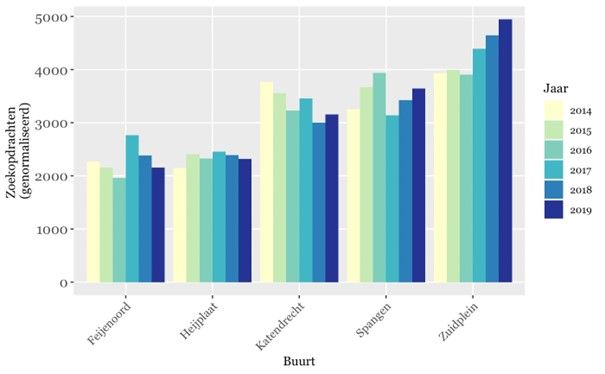
In a pilot, we added two new variables to this model: Google search behaviour for a neighbourhood and the number of Instagram posts from a neighbourhood. Both variables can be an indication of interest in neighbourhoods.
Below, for example, the searches for five neighbourhoods in Rotterdam are visualised in the period from 2014 to 2019:
The result
We presented our work and advice in a report to Vesteda's Data Science team and Corporate Communications department. This allows the teams to get started with social listening. The social listening data was ultimately not used in the Neighbourhood Score model, but it did provide new insights: Google search behaviour for and Instagram posts from a neighbourhood was not an explanatory factor for experts' judgment on the potential of a neighbourhood. That, too, is a result!
In addition, the Data Science team learnt from the differences in the amount of social listening data per neighbourhood.
Want to know more?
Joachim will be happy to talk to you about what we can do for you and your organisation as a data partner.
Business Manager+31(0)20 308 43 90+31(0)6 23 59 83 71joachim.vanbiemen@digital-power.com
Receive data insights, use cases and behind-the-scenes peeks once a month?
Sign up for our email list and stay 'up to data':