A comprehensive understanding of the customer journey with Google Analytics and R
ONE Business
- Customer case
- Data Analytics
- Data consultancy


ONE Business websites allow users to buy subscriptions to various magazines. The online sales funnel can hereby be dynamically divided for each offer. For example, it is possible to give users free term choices or to limit them to a specific offer. Because the sales funnel is dynamic, it is impossible with the standard Google Analytics implementation to gain good insight into the customer journey. ONE Business asked us to provide insight into where people opt out and why. This will enable them to optimise the funnel for more online conversions.
Our approach
ONE Business websites use different URLs for the same page in the funnel. This is because the URL changes based on the acquisition campaign. Therefore, we started by giving each page a unique name. Based on the page name, we can see how many page views and users a particular page is getting. Based on this information, we initially mapped the sales funnel manually. This gave us a general picture and we were able to formulate an action plan.
We automated the analysis of visitor behavior by writing an R script. Via an API call, the number of page views and the number of users on the current and previous page within the funnel are loaded from Google Analytics into R.
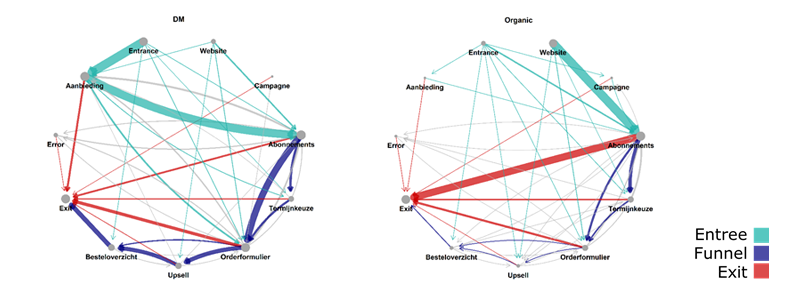
To improve the output of the script, we cleaned up the data. We visualized the different steps and their mutual connections based on the previous and current pages. We also set up the funnel based on the page name instead of the page URL. Finally, we were able to calculate the number of exit moments per step in the funnel. In addition, we visualized a total roadmap of the sales funnel based on this data.
The result
ONE Business now has insight into the entire online sales funnel. The results can be viewed in a timeline and it is possible to compare periods. Performance can also be viewed per segment. It is now fully transparent how many users enter and exit at each step in the funnel. We can also see how many users are retained.
Thanks to the improved insight, bottlenecks in the funnel have come to light. Based on this, we made practical recommendations to optimise the sales funnel. Once these have been implemented, the script can be used to evaluate which changes have led to more online conversions.
In addition, with the help of the script, ONE Business has more insight into visitor behavior – and therefore the success – of individual campaigns. The script also offers the option of A/B testing offers and campaigns.
Want to know more?
Our CEO René would be happy to talk to you about what we can do for you and your organisation as a data partner.
Receive data insights, use cases and behind-the-scenes peeks once a month?
Sign up for our email list and stay 'up to data':